You're reading for free via Max Stepanov's Friend Link. Become a member to access the best of Medium.
Member-only story
7 steps of A/B testing
A/B testing. A/A testing. A/B/A testing.

To make your digital product attractive and user-friendly, you can conduct A/B testing. With it, you can increase the achievement of targeted actions, increase conversion and get more profit.
What is A/B testing and what is it for
A/B testing is research that allows you to evaluate two variants of a webpage, for example, and find out which of them is more effective.

Almost any content and settings can be tested:
- web pages and their elements;
- ads;
- management strategies and approaches;
- emails and mailing list items,
- and cetera.
To conduct it, you need to divide the incoming traffic into two equal parts and one half of the visitors show version A, and the other version B.
After the end of the experiment, you need to check which page has brought more targeted actions, for example, registrations, purchases or page views and use it in the future.
A/B testing can help increase website conversion. After all, thanks to it, you will be able to find out how changes in design affect the behavior of the audience. You can also check how your hypotheses affect the number of orders, time spent on the service and other metrics.
A/B testing helps to understand what changes on the site can bring you profit. As well, testing helps to resolve disputes and assumptions of your colleagues about the design and interface of the service. With the help of the test you will find out the really working version. In addition, you can customize your digital product, so that, your users can easily and conveniently perform targeted actions on it.
A/B testing is not a way to increase conversion. A/B testing is a way to test your hypotheses. And nothing else. You have various hypotheses, and it is A/B testing, that allows you to confirm whether your hypotheses will work out well or not. That’s all. It will never solve all the problems of your business. It can only help to make the right decisions, as each of your hypotheses will be confirmed by data.

To improve the performance of the site, you first need to test the hypotheses regarding the elements that affect the conversion. These include calls to action, buttons, forms, and images.
But before you begin the test, consider whether you really need it and whether you have everything to implement it.
For the test results to be correct, you need a sufficiently large amount of traffic, regular conversions (registrations, bids, purchases) and a streamlined web analytics system.
If you do not have all this, then it is better not to carry out testing, because it will not give reliable results. If everything is available, feel free to proceed to the test.
How to start a test
1) Formulate a hypothesis

Before you start testing, decide which assumption you want to test. To do this, you need to clearly define your hypothesis. They indeed should not be invented, it is necessary that they have a rationale. Build hypotheses based on web analytics and analysis of visitors’ actions on your resource.
Ideally, the hypothesis appears as a result of the research: talk with customers — why they love your product, what problem it solves, analyze support requests: what are the pain points, look at the statistics: find pages with a high percentage of outputs or anomalously low conversion , use the metrics to trace what people generally do on your resource, how they behave.
For example, web analytics show that users rarely click on the “Buy” button. Maybe it’s because she is petty? Or because it merges with the general background?
You can formulate several hypotheses, but in one test you can test only one. That is, in the case of a button, two different tests are needed — for size and for color. If you test several hypotheses at once, you cannot understand which of them worked.
An important rule is — that in one experiment only one change can be tested.
2) Identify targets
After you have decided which hypothesis you are going to test, you need to select the criteria for this specific test.
As the criteria can be: bounce rate (how many people visited the page and immediately gone), the time spent on the service resources, the number of applications or registrations, the number of purchases or the average check.
Here we return to the beginning: what problem needs to be solved. For example, you sell an online Self-pleasure course. You want to increase sales of one of the three programs and highlight it in color.
Then, when comparing two pages, the criterion will be the sales of this particular program. It does not matter how much time visitors spent on the page, how many of them sent a request, how many bought other programs, or how the revenue changed. No, we are interested in the change in sales of this option.
And make sure that you have configured a web analytics that traces it.
3) Select one test item
This is what you want to test your hypothesis with. For example, if you assume that the red button will be more noticeable on the page and will increase the number of registrations, then you need to test its color. You can test any element on your page:
- Headings and subheadings (length, content, location);
- Calls to action (length, content, location);
- Buttons (color, size, location, text);
- Images (size, content, location);
- Text on page (length, content);
- Forms (location, size, number of fields);
- Prices of goods and so on.
After you have chosen which element you will test, you need to create a copy of the page and make needed changes to it. And as already mentioned, for one test you can test only one hypothesis and make only one change.
4) Determine the Test sample size
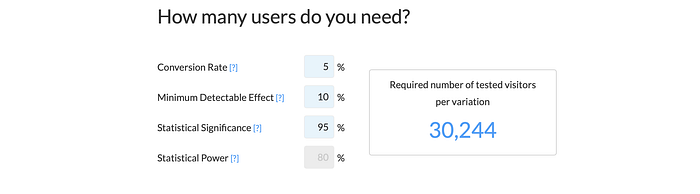
To do this, you need to calculate in advance how many people have to visit the page so that the test results are statistically significant (that is, they could not occur by chance), and they can be trusted.
The sample number depends on how much change you expect to see. The stronger these changes, the fewer people will be required to sample. And you can calculate it for example with the help of online calculators: Optiizely, AB Tasty, Unbounce, AB Test Guide and others.
Think about whether you will show the pilot page to all visitors or only for parts. If you show everyone, then the required number of people will be faster. On the other hand, if the hypothesis turns out to be wrong and the new page has a lower conversion, there will be losses.
Also pay attention to the composition: new visitors or regular. It is likely that among the regular visitors the experiment will not be clear: when people are already accustomed to one interface, their reaction to changes will not be the same as those who see it for the first time.
5) Determine the duration of the experiment
The test should last at least a week, even if you scored the right number of visits in two days. This is necessary because users behave differently on different days of the week.
If the target indicator is a purchase and you know that usually, people don’t do it immediately, but after 10 days, then this should be taken into account. On average, the recommended testing time is 10–14 days.
Having decided on the time, never stop the test before, even if during the first few days one option is confidently leading. For reliable results takes time.
6) Do A/A testing
This is when you show all users two absolutely identical pages and track the results.
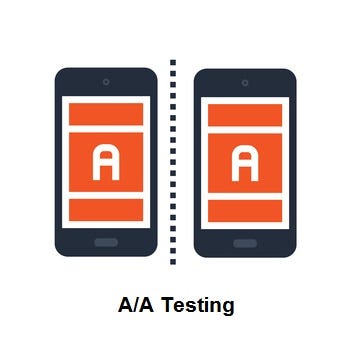
If they match, then the traffic is uniform and the results of A/B testing will be reliable. If on an A/A test, the results of one page are very different from another, then it does not make sense to conduct an A/B experiment, since it will automatically be incorrect.
To save time, A/A testing can be carried out inside the main test, as a result, you get A/B/A testing. To do this, you need to divide the traffic into three identical streams and show option B to one of them and A. to the other two. If the results of pages A and A coincide, then the test was reliable.
The disadvantage of this approach is that in order to achieve statistically correct results, you will need two times more traffic.
7) Do A/B Testing
After you have formulated a hypothesis, chose goals, figured out the duration and sample, were convinced of the uniformity of traffic, you can proceed to the main test.
To conduct it, you need a special service, for example: Google Experiments, Changeagain, VWO, Optimizely, ABtasty.
All these services differ in price and functionality. For starters, it’s probably worth learning Google Experiments and doing your tests there. It is free and directly related to Google Analytics.
That’s all. Be patient, use this article as a Check List and carefully plan your tests. Then the results will certainly bring you success.