You're reading for free via Taylor Nguyen's Friend Link. Become a member to access the best of Medium.
Member-only story
A metrics-driven approach to evaluate success of UX design
Define success, measure baseline, and measure after design.

As part of a design thinking squad at my company, I jump in and out of products at different points in their life cycles. Within the span of a few weeks to months, I have to demonstrate the strategic value of design and research. That often requires showing the metrics that design has impacted in addition to its intangible values.
I follow a metric-driven framework to quantify the value of design and to evaluate project success objectively. This framework is inspired by Lean Six Sigma’s DMAIC methodology.
The nice thing about this framework is that it defines a general process that you can then combine with other resources like Google’s HEART framework or System Usability Scale (SUS) if you’ve already used them.
The gist of this framework is quite simple: define success, measure baseline, and measure after design.
Here’re are the steps to implement this metric-driven framework to evaluate the success of design projects.
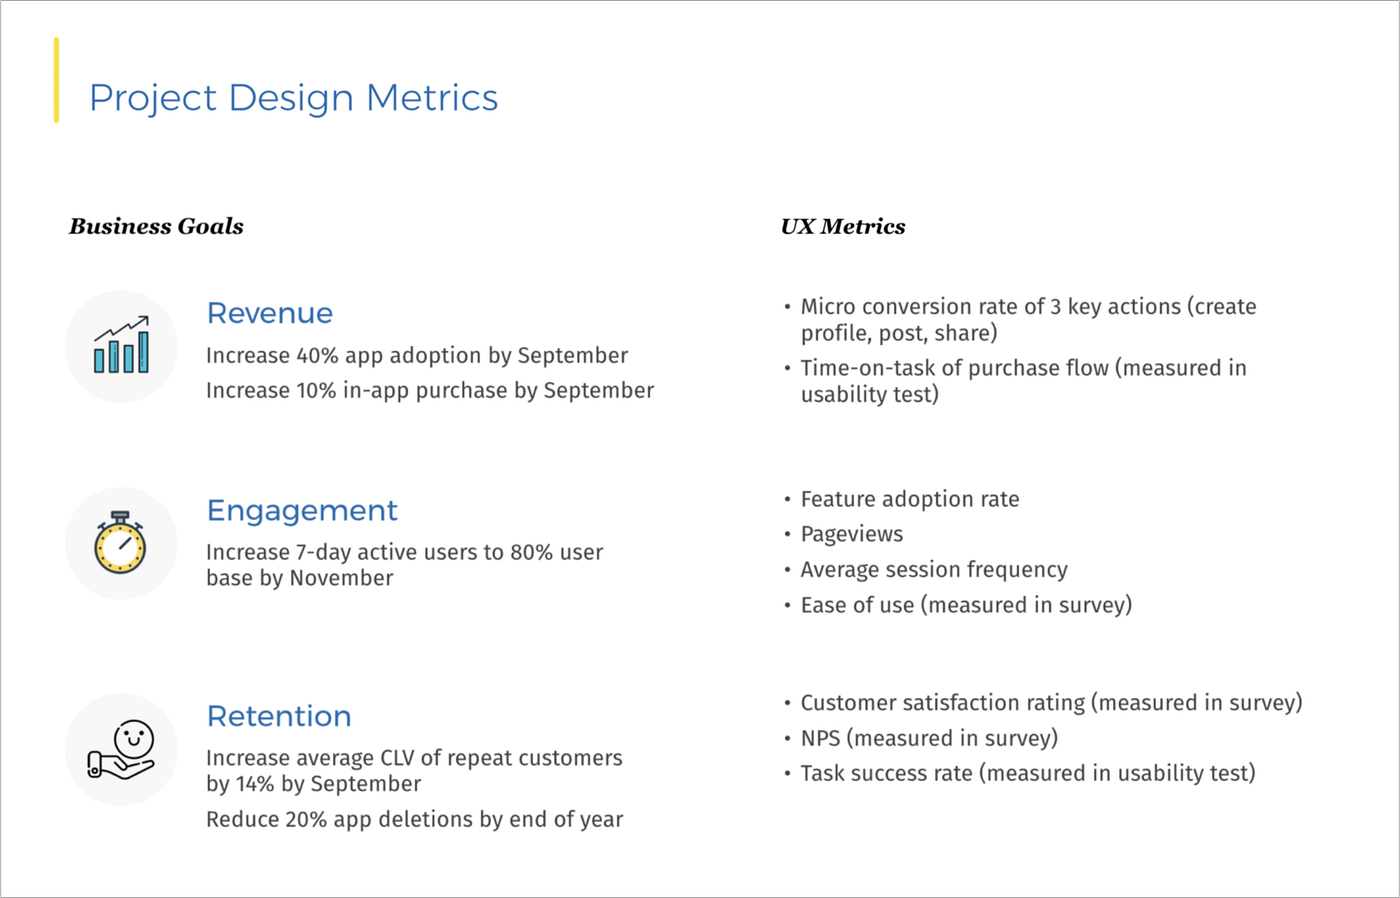
1) Understand business goals
There’s a massive number of metrics you can track, so your very first step is to understand which metrics will have the most impact on the bottom line of your business.
Gather knowledge from your business stakeholders:
- What are the most important metrics for the business/product?
- What are the business values of the new product/feature?
- How do we measure the success of the new product/feature?
2) Translate business goals to design KPIs
Your business stakeholders will give you some business KPIs, which are likely related to revenues, cost, or growth. However, it’s hard to attribute the improvement in these metrics to solely design as there are multiple factors affecting them. Because of this, you will need to define user experience KPIs that you can influence.
For instance, adoption rate can be attributed to both design and marketing, but task success rate is driven by design.
These resources will help you find the design metrics for your project:
- If you design prototype: Usability Metrics
- If you design app: HEART framework
- For any type: 7 common UX KPIs and how to measure them
After you’ve selected the metrics, come back to your team and make sure they perceive these metrics as important as well. Show them how these metrics are connected to the business goals they’ve told you.
3) Set targets
Now that you’ve got a set of metrics, you’ll need to define what changes to these metrics will be considered a success.
Authors of the Lean Analytics book describe setting a target as drawing a line in the sand. These targets aren’t carved in stone. They’re adjustable, but they force you to think through what success looks like in advance. Moreover, they hold you accountable to take action if the results are far off your expectations.
If you wait to decide what is success after collecting results of the design, there’s a high chance your judgment will be biased by the actual results, the efforts you’ve put in, among other factors.
You will work with your team to define the targets. You can also search for industry baseline for what is normal or ideal as a starting point, or use benchmark studies to know how your competitors are performing.
Setting targets can be quite arbitrary at first. Your sense of what success looks like for your company and product will get better over time as you do more experiments.
4) Measure baseline
Here’re some methodologies to collect baseline metrics:
- Survey → Satisfaction, Likelihood to recommend, SUS, Ease of use
- Observation (e.g. ethnography, usability test) → Time on task, Errors, Task completion rate. Note: Use guerrilla testing if you can’t get access to users for baseline measures.
- Interview, Survey → Perceived effort and time on task (more subjective than observation methods but much quicker to gather)
- Analytics → Conversion rate, Session duration, Session frequency, Average order value etc.
- Customer support logs → Total support tickets, Support cost, Feature usage/Month
- Online words-of-mouth → App rating, Social media rating
5) Measure after design
Measure the metrics you’ve set out to measure.
If the results fall below targets, come back to your team with hypotheses of what might have happened. Are users aware of the changes at all? When they use the new feature, at what step do they drop off? Based on the hypotheses, you might need to do usability testing to find problems or A/B test design tweaks to improve the results.
If the results hit all targets, awesome — you’ve got a successful case study to showcase to others!
Making your measurement plan repeatable
This measurement framework can be a lot to add on an already-full plate of a designer. But the process is a lot easier after the first time.
Step 1 and 2 will be fairly stable for a product with an established business model. Step 3 won’t take up much time.
As for steps 4 and 5, periodic assessment of the product like (e.g. biweekly analytics reports, monthly usability test, annual survey) should give you all the metrics you need without starting another research initiative.
Designers don’t need to be obsessed with metrics (and we shouldn’t either), but numbers help us assess our work objectively and increase credibility with our clients.
We can quantify the impact of UX design by following a metric-driven framework: defining success, measuring baseline, and measuring after design.
Give it a try on your next project! It might feel unfamiliar at first, but this process is much easier to implement and repeat after the first time you do it.