3 simple steps to design and analyze user-centric surveys
How to get meaningful insights from a survey and design it from scratch.
A survey plays a vital role in any kind of user or market research to make precise decisions and gather important insights. It’s important to design surveys in a proper way to get the best results and this is always a great tool for UX Researchers.
What is a Survey?
Technically, A Survey is defined as a research method used for collecting data from a pre-defined group of respondents to gain information and insights on various topics of interest. Fundamentally, a survey is a method of gathering information from a sample of people, traditionally intending to generalize the results to a larger population.
Why Surveys?
Surveys are becoming a powerful tool these days. It’s relatively inexpensive, quickly executable, and easy to collect a large set of information, and is used to gather information on a wide range of topics. Surveys play a great role in gathering feedback on a live or a pilot product, Measuring the satisfaction level of users for a live product. You can also get general comments from customers for improving your existing product.
Well, I’m not here to explain survey definitions for you to memorize. 😅
This article is all about how we can prepare for a user-centric survey from scratch, test, and execute it in the most efficient way to get better results in just 3 simple steps.
STEP 1 — OBJECTIVES & QUESTIONNAIRES.
The Goal ⚽
To achieve something you need to know your goal first. Like in football to know your opposite goalpost to score a goal. Knowing what you want to achieve after getting survey data is important. So defining the objectives is a must. How to define the objective like a pro?
- The Winning Score: Let’s start with what are the main questions we want to answer. What do you want to learn? What is the main focus of the survey?
- Players: Who do you want to play with? Who is your target user group(s)? What demographics do you want to know about?
- Tactics: How are we going to use the data we collect?
Tool 🔧
If you wanna kick the ball hard, you need good shoes. Using appropriate tools for the survey and defining expected results is important as well. There are several tools out there on the web. You can use Google Forms completely for free. There are some other powerful tools like Survey Monkey, Typeform, SurveySparrow, etc.
Surveys are not just some yes/no questions! 💯
A single survey can hold up to multiple types of question sets. As there are so many types of questions, It’s important to ask appropriate questions to get the correct answers you are looking for.

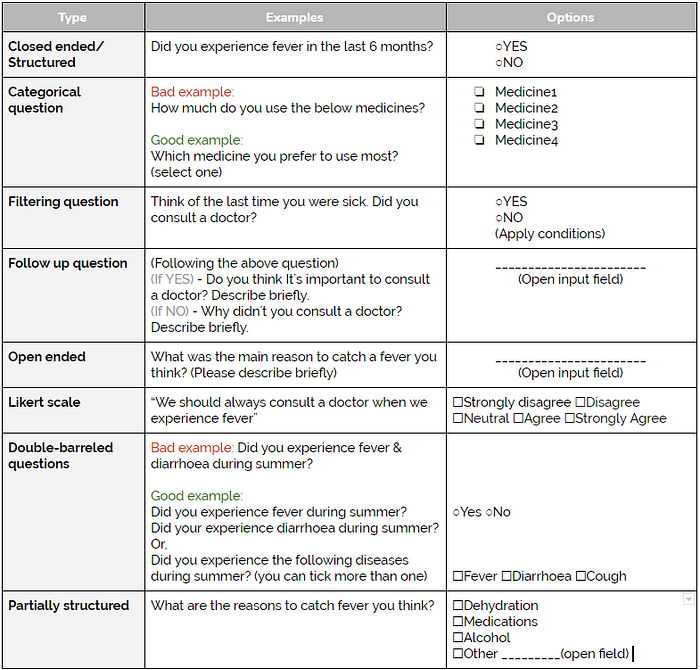
Question types
1. Structured: Structured questions are questions that offer the respondent a closed set of responses from which to choose. Structured questions make data collection and analysis much simpler and they take less time to answer.
This question set includes:
A. Categorical questions: When we want a simple count, like “40% people like X” then we should go for categorical questions, for example: Yes/No, Checkbox, Multiple choice questions, etc. These types of questions are called Nominal questions as well.
B. Filtering questions: Filtering questions apply when we need to filter audiences with specific questions and conditions like, What do you like most? Juice or Milk? This is how the audience will be filtered and will be asked a different set of questions.
C. Ranking Questions: Ranking questions let you list several answers and respondents can rearrange them into the order they want. That way, they can give feedback on every answer we offer. It’s a great way to see which items people like most and least at the same time.
For example, Which Season do you like most? Rank in order of preference. Summer/Monsoon/Autumn/Late Autumn/Winter/Spring.
2. Non-structured: Non-structured questions are open-ended questions, where there is no list or partial list of answer choices from which to choose. Respondents are simply asked to write their responses to a question.
This question set includes:
A. Open-ended questions: Open-ended questions are used when we want respondents to answer briefly on a topic question with no specific conditions/answers.
B. Follow-up questions: Follow-up questions are used when you want to follow up on a previous question to get into more deep and focused answers.
C. Partially structured questions: Partially structured questions are more like a mixture of open-ended and closed-ended questions. When we want some specific answers and also let the respondent add more if they want.
To get the best out of a survey it’s better to split the survey into psychographic and demographic questions. What are demographic and psycho-graphic surveys?
“Research is to see what everybody else has seen, and to think what nobody else has thought.”
~Albert Szent-Gyorgyi
Demographic: Demographic surveys are more like hard data. Age, Gender, Location, Profession, etc. While demographics are still valuable and can be used as a starting point, they don’t shed light on the interests of an audience.
For example, if you’re building something for the youth, age is an important fact and key detail there.
Psycho-graphic: Psycho-graphic studies aim to achieve a deeper level of understanding of the person’s tastes, preferences, opinions, line of thinking, and emotions of a group of people. Exactly the things researchers/marketers need to understand to best position their products. Since these attributes vary immensely from person to person, collecting psycho-graphic data needs a more perceptive line of questioning.
For example, If you want to start a food business, the question might look something like this:
What type of food do you prefer in the morning?
- Bread
- Butter
- Soups
- Heavy Meal
- (Write your own)
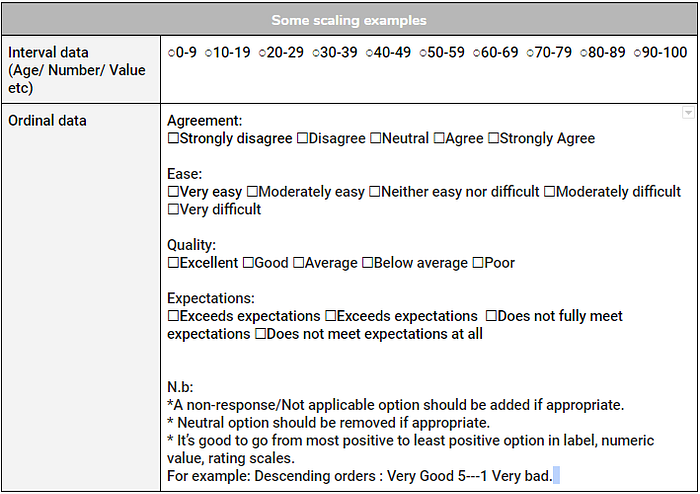
Scaling: When designing a survey questionnaire, ‘Levels of Importance’ questions help us to assess what is most important to our customers. These detailed types of satisfaction questions can help us to understand what products or services we provide that our customers value most. Properly measuring the level of importance will garner critical information that ensures we continue to provide what is expected or modify what is not.
When designing the level of important questions in your satisfaction survey, you need to assume the following:
- Respondents used the products or services you are inquiring about.
- Respondents can recall using the products or services and can give a considered response.
STEP 2 — TEST & IMPLEMENT
The great QA-AAAAA! 🔥
Kidding.. there is no extra A, you just have to make sure you delete that while doing your survey Quality Assurance. Before sending any final push to the actual users you might love to conduct a testing survey first, which can be internal or a pilot. Often we make some silly mistakes that nearly kill everything. So pilot surveys help us make sure we did all right and believe me this is a very important thing to remember.
What are the things you can check during a QA? well, a survey question has so many logic and conditions. check them up if they’re all okay! also, how is the response coming, Are there any grammatical mistakes?
Now you shoot your survey! Booom… 🚀
After shooting the survey there are certain things to monitor-
Sent vs Click: It’s great to track the total number of users shot vs the total number of users clicked. It indicated your user engagement with the product as well.
Time-Zone: Time is an important factor. Your users can be in different time zones or maybe the user group you are targeting is more active at night. Time-engaging matters. Think about it!
Completion rate: Compare the data of users clicking on it, filling the first page(s) (if applicable), and completing the whole survey. If the completion rate is low then you may have to rethink the questionnaire structure.
STEP 3 — Analyse
Cleaning your data! 🔎
Preparing the survey data for analysis can be a messy process most of the time. For example, respondents’ answers may not always match predefined choices or they may answer questions that don’t apply. To clean up the unnecessary information:
- Make a copy of the survey data first.
- Eliminate duplicate and incomplete responses.
- Remove flatliners, who picked the same answer to every (or most) multiple-choice question in your survey.
- Remove the speeders, and respondents who took the survey too quickly. Identifying responses like this is based on the median time spent taking your survey. (This might not apply to Google Forms, as Google Forms doesn’t support tracking time to fill up a survey.)
Analysis 💡
1. Sample size: One of the most important parts of starting survey analysis is by checking out that we have a sufficient sample size. For that, we have to consider from the beginning how many people we need to survey to get an accurate result.
2. Tabulating:
A. One way tabulating: The most common and straightforward form of analysis, and one that often supplies much of the basic information needed, is to tabulate results, question by question, as ‘one-way tables’.
B. Cross-tabulating subgroups: At the beginning of your survey, you will have set up goals for what you want to achieve and exactly which subgroups you want to analyze and compare against each other. So this time you need to check how the respondents responded.
3. Focusing on the insights: It’s important to focus on the insights rather than data. While analyzing the data we should fetch all sorts of possible information and find insights from that.
Data ⇨ Information ⇨ Insights
4. Complement with other types of data: It’s great to have different supporting data sets apart from the direct survey data. it’s always helpful to use different data points which might include even personal experiences. If you have qualitative research that supports the data, use it if appropriate.


Going deep…
1. Predictive modeling: Predictive modeling is a way of predicting a set of variables by looking at another set of variables.
Driver analysis is one way of doing predictive modeling. Driver analysis quantifies the importance of a series of predictor variables in predicting an outcome variable. Each of the predictors is commonly referred to as a driver. It is used to answer questions such as:
a. What drives my customer to switch to another brand?
b. What is the best way to improve the preference for a brand? Etc
I really loved the article A Comprehensive Guide To Predictive Analytics written about predictive modeling and this comprehensive report on predictive modeling by SOA.

2. Segmentation: Segmentation is a great way to advance survey analysis for market research. Since segmentation divides the data into comparatively homogenous groups, marketing efforts such as targeting, positioning, retention, and product development can be more efficiently performed. One of the simplest ways of segmenting the data or starting with it is basic cross-tabulation analysis. Respondents can be divided into, say, age or income groups, and their differences are studied across a variety of questions.
One way of doing segmentation is cluster analysis.
- Cluster analysis: Cluster analysis is a traditional method of segmentation. This is a family of methods that subsumes many variations and can be broadly classified under two distinct groups: hierarchical and non-hierarchical methods.
For inspiration, I found a great article on Cluster Analysis and Segmentation with a brief intro and the steps of attempting cluster analysis on segmentation.
2. Perceptual mapping: Perceptual mapping is a chart to depict and understand how to target the customer’s view and feel about a given brand or product. These charts help to understand the brand or product’s competitive positioning of an organization. Respondents are asked to rate their views on a product’s performance, satisfaction, pricing, packaging, etc.
Qualitative answers from the survey are then transferred to a perceptual map using a scale, (for example Likert Scale). The analysis of the chart is then used to inform product development and improvement.
Insight Creation
To show what is important and what is not, getting real actionable insights is very important. Actionable insights are direct, meaningful actions that can be taken from analyzing any type of raw data. They are often the result of data analytics that provides enough data for organizations to make a well-informed decision.
Getting important insights can be easier by following the below points
- Insights should be closely tied to key business goals.
- You need to understand why insight is important or unique.
- An insight is incomplete unless it explains why something has happened.
- If insights aren’t directed to the right decision-makers, they might not get the consideration they deserve.
- Successful insights will challenge or evolve the current beliefs and reveal new patterns.
For example, Customer surveys such as NPS, where you ask what your customers think about your products and services can be a great point to get actionable insights.
I really hope this article will help you create the best survey next time!