Frameworks for measuring product inclusion and product equity
A few working frameworks for PMs, execs, small teams, and startups.

You can’t change what you don’t measure — and measurement is a core challenge of building inclusive products.
In this post, we’ll cover micro-level quantitative frameworks for measuring product inclusion and product equity — areas like representativeness, product outcomes, and subjective experience — as well as more macro-level mitigating methods like boosting negative signals and Red Teaming. To build truly inclusive products you need to safeguard your marginalized users on both fronts. These frameworks are meant to be actionable, low-cost, and low-lift; my hope is that you’ll be able to apply them at your small startup or within your team at a large company.
Ultimately, these frameworks are heuristics that help you consider the experience of marginalized users — that’s where it all starts. Once you do that, you can build systems to systematically measure and improve their experiences.
Here’s what’s on deck:
PART 1. Quantitative frameworks for measuring inclusion
- Representativeness (i.e., equity of access and opportunity)
- Product outcomes (equity of impact)
- Subjective measures (equity of experience)
PART 2. Methods for mitigating harm
- Boost negative outcomes
- Red Teaming
User-centered whatever
As is well known, datasets and software contain the biases of their creators. We’ve seen in recent years the boom in user-centered everything — design, research, testing, and development. But user-centered design only implies inclusion, and does not require it; it’s a helpful heuristic, but incomplete.
Let’s think about user-centric design in material terms. Who are the people that create software? Tech companies are largely run by white men, funded by white VCs, coded by white engineers, and tested with white users. It’s no surprise that we see snafu after snafu — how AI misidentifies black people as gorillas, how VR headsets don’t fit women, how misinformation can fuel genocide. (I’ll talk more about mitigating events in Part 2 of this post.)
Beyond user-centered design, you need to take an active interest in the experience of marginalized users to build properly inclusive products.

PART 1: Quantitative frameworks for measuring inclusion
These three frameworks will help you monitor product inclusion in the normal course of product development of your app/service/website/etc. They can help you set up KPIs and measurable benchmarks as you build out your product inclusion efforts.
Framework 1: Representativeness (“equity of access and opportunity”)
The first way to think about your product is on access: Is your product reaching all the people you hope it will? This seems like a fairly straightforward problem, but implementation involves careful data collection, measurement, and strategy.

Some notes:
- Your first question should be: Whom do you currently build for, and whom do you want to include? Here I’ve noted the dimensions of race and sexual identity, but you can collect data on age, income/SES, gender identity, ability, digital literacy, anything really. For simplicity’s sake, start with a broad category like race.
- Next, you need to collect the right data for each of these segments. For many companies, this will be a process that could include updating your onboarding or sending surveys. It’s not straightforward or without ethical dilemmas. You must navigate user transparency (“what is this for?”) and trust (“will you discriminate against me?”).
- Once you have the data, you can set benchmarks based on your “target market” — something you need to be explicit about, and that carries its own ethical implications. If you’re on the U.S. Instagram team, is your “target market” all of the US (330MM people, in all their diversity)? Or is the just Americans with iPhones (a smaller and more lucrative pool of users)? I’d encourage companies to aim for the most ambitious targets and widest possible markets. Regardless, it’s important that you set targets and that your staff know them.
- As you build your product, use this framework to help measure “penetration” into new user segments. And you can use this matrix to evaluate other parts of your development process, like user research.
- I should note that you should also track representativeness and diversity across your own staff. How are you mirroring the communities you hope to serve?
Framework 2: Product outcomes (“equity of impact”)
Our second framework is based on your user’s actual product experience. How do specific groups differ on your KPIs and what does that mean for their lived experience? For this example, we’ll use Duolingo.
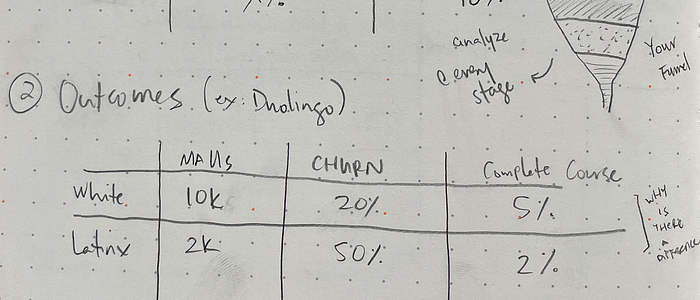
- Let’s say that Duolingo uses the following KPIs to measure value: MAUs, churn rate, and outcome-related metrics like “courses completed” or “lessons taken”
- Here, I compare white users to Latinx users. You’ll see that Latinx users underperform in most categories and that they aren’t getting the same value as their white counterparts. Why?
- These discrepancies can signal where to focus inclusion efforts. User research might reveal that these two segments have different learning styles. Or perhaps that your content varies in quality; maybe it’s the case that white users flock to the Spanish course (a stronger course) but Latinx users enroll in the ESL course (a weaker one). It’s not uncommon to see undercooked ESL material.
- You can use this framework to measure feature usage or funnels across your product. By tracking your onboarding, you might discover it has a low conversion rate for people with screen readers because those pages are missing key accessibility features.
- Note: I prefer to focus on outcome metrics because they most closely track your product’s real-world impact on that user. But you can apply this to all your sets of product metrics (see this thread from Shreyas Doshi): health metrics, usage metrics, adoption metrics, satisfaction metrics, ecosystem metrics, outcome metrics.
Framework 3: Subjective measures (“equity of experience”)
This third framework helps you quantify a user’s subjective experience and set targets against it. One common instrument that companies across industries use is called the Net Promoter Score (NPS). The NPS is a simple question, with a 0–10 scale, that helps gauge value and satisfaction: “How likely is it that you would recommend our company/product/service to a friend or colleague?” What could an NPS look like for inclusion?

- The wording for the NPS-like instrument is important. Here I use: “Do you see yourself in this product?” But you can also mirror the NPS language: “Would you recommend this product to someone of the same X” where X is your segment of interest.
- You can then use this NPS to measure your inclusion efforts over time. I’d recommend asking this question quarterly or every six months because it takes time to change user perceptions of value and inclusion.
- There are many ways to implement an NPS — don’t get caught up in the details. What’s important is that you start collecting this data. You can iterate or expand over time (though of course you’ll need to be careful to keep comparisons apples-to-apples)
- One day, I’d love to see us get to an industry standard so we can compare performance across companies. For now, your own will do.
PART 2: Methods for mitigating harm
The three frameworks above are great, but they can lead you astray if used in insolation. You can drive your product’s equity in access, outcomes, and value — but continue to put your marginalized users at risk. Here are two methods for mitigating harm.
Method 1: Boost negative signals
Negative signals can be more illustrative than positive ones when considering product inclusion. Because your marginalized users necessarily represent a smaller share of your total user base, you need to amplify their signals — especially when they’re negative. (For more concrete advice, read my post form a few weeks ago on inclusive data analysis.)
Here are some tips:
- Analyze your customer service tickets. Have your user support team tag tickets that involved protected segments. Read those reports. Follow up with users when possible.
- Aggregate informal user feedback. Have your team look at feature requests, bug reports, social media posts, emails. Create a Slack channel or Google Doc and aggregate this feedback to identify trends.
- Ensure your research is inclusive. Include marginalized people in your user research and usability testing plans. Consider paying participants so that you’re financially inclusive.
- Talk to and listen to your staff from diverse backgrounds
Method 2: Red Teaming and imagining Black Swan events
As long as companies have existed, so have externalities. Companies have inherent blind spots, and not just because of a lack of diversity. The profit motive can create myopia that results in harmful externalities for their customers — think of nicotine and lung cancer, fast food and obesity, the climate crisis, etc. How can you avoid creating disastrous outcomes for your users? Accept that your product will produce unintended consequences and Black Swan events — and try to get ahead of them.
A few ideas:
- Red Teaming is a popular method for identifying and mitigating risk. You essentially have one of your internal teams role play as adversaries (like hackers, trolls, competitors, etc.). They pretend to be bad actors and abuse your app to produce harm. Try running that exercise with an explicit imperative to harm marginalized users. Understand the harm your users can do with out-of-the-box features and with lesser-known features as well. Facebook could have easily prevented discriminatory targeting by Red Teaming their ad tools.
- Another method is to imagine Black Swan events — those extremely edge cases that can prove catastrophic for certain users. Say you’re Robinhood. What would happen if one of your users made a trade and your UI mistakenly displayed a loss of $750K — causing that user to take their own life? (The GameStop fiasco is another example of how RobinHood failed to imagine the worst-case scenario.)
- In general, try to look beyond yourself. Solicit outside counsel to help understand how your tech can be exploited and harm people who are different from you.

Product inclusion is a work in progress
These frameworks and methods are just a start. As D&I work takes on greater importance and urgency — fueled by catastrophic oversights like the ones above — I expect we’ll see more techniques for measuring and tracking product inclusion. I’ll continue to write on this topic as I come across resources. And please do send them along in the meantime. — XML
A few interesting stories from the week:
- The Trevor Project rolled out a new product to train its volunteers that is based on GPT-2, an open source AI. Development took months, not years — nonprofits take note! (MIT Tech review)
- Chris Dixon writes about how NFTs (non-fungible tokens) — essentially “digital collectibles” powered by blockchain — can help creators monetize their digital works (Andreessen Horowitz)
- More on funding creators. Read about the Buy Music Club, a platform built on top of Bandcamp, that makes it easy to buy indie music (Pitchfork)
- Sign up for Somewhere Good, a beautiful new social network for POC — interesting trend towards more community-based alternatives to mainstream services. The sign-up asks for your pronouns and astrological sign ❤ (Somewhere Good)
- NYU Professor Scott Galloway illuminates the power of 2x2 matrices by looking at attention and monetization (Prof Galloway)
- On the topic of attention, these two long reads are must-reads on our modern world: Shoshanna Zuboff on policy solutions for surveillance capitalism; and Michael Goldhaber on the attention economy (NYT)