Member-only story
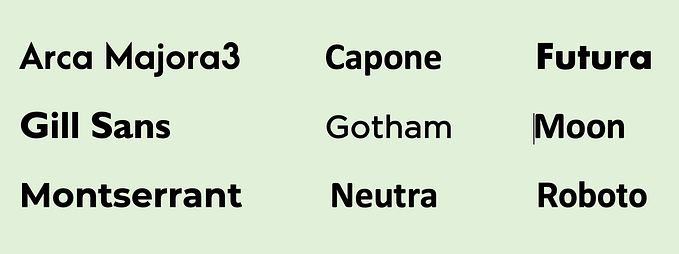
From bland to bold: four steps to a memorable chart
#25: Transition from a line chart to an area chart

Colin Ware states reading data visualization is a two-step process. It starts with recognizing what questions can be answered and is followed by finding the answer to them. In the first step, affordance and discoverability play a crucial role. Familiarity with the chart type and well-designed elements will help translate the question into a visual query. In the second step, the most important is the usage of pre-attentive attributes that make information easy to distinguish.
For this week, I chose the chart presenting the change in the inflation rate for eggs in the EU, which was created by Eurostat. This is an excellent example of a visual that needs to improve on both of the mentioned steps. Firstly, the bland design makes the chart easy to miss. Secondly, poorly formatted elements make them hard to distinguish. The lack of visual hierarchy puts primary and secondary information on an equal footing, forcing us to consume every element to understand the design. Typically, we can tell the data-ink from the non-data-ink and focus on the former when looking at the chart. With the overly simplified design, it’s not easily accessible. There is a simple design, and there is a too-simple design.