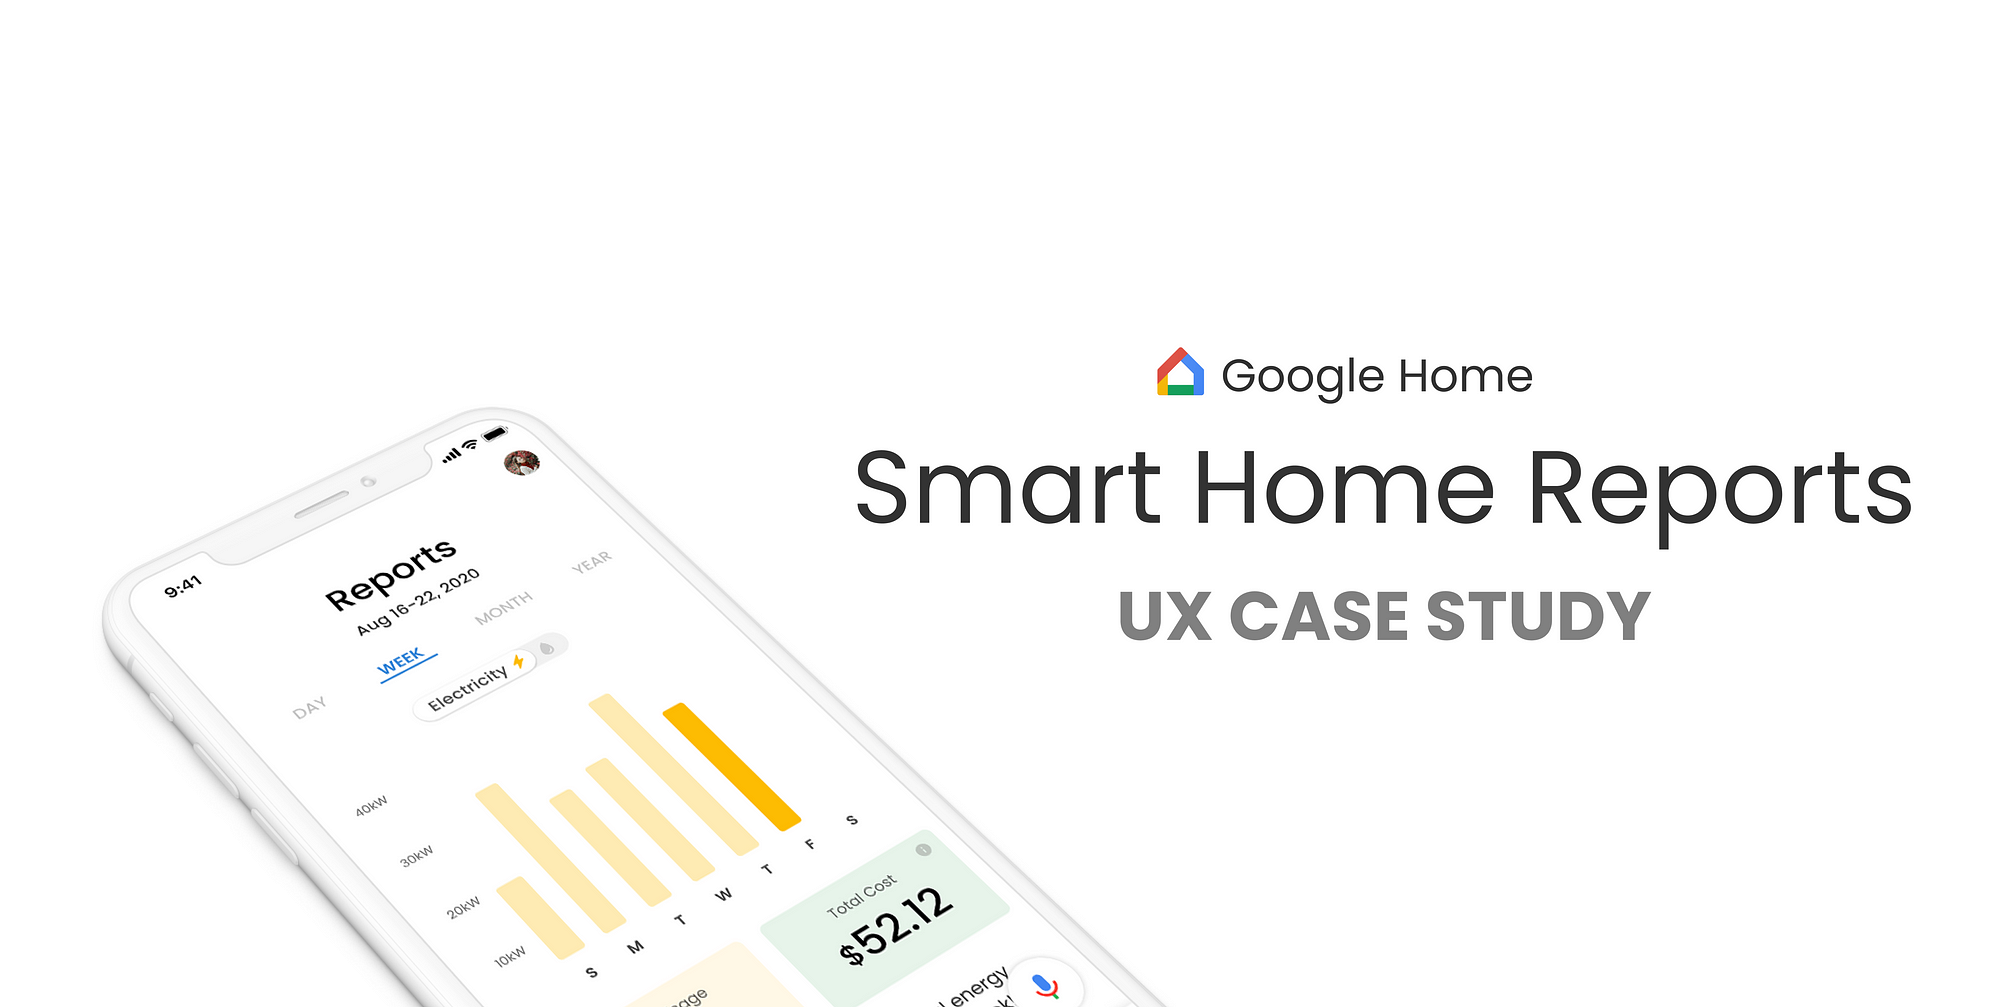
Google Home Reports UX Case Study
Designing an electricity and water report screen for the Google Home mobile app
This project focused on designing a report screen for the Google Home mobile app to demonstrate how providing data on smart home products can have a large positive impact on users and the environment. This was a remote group project that was completed by Gavin Liang, Kimberly Leung, and Peter Ip in one week. The project is submitted as part of the Product Design Competition held by Product Design Tips. (Edit: We are happy to share that we placed 3rd in the world for this challenge!)
Smart homes can save up to 30–40% of energy based on different settings and by optimizing the smart home products that are used in the homes. However, many users do not receive adequate data or reports on their consumption of energy based on the smart home products, nor are users provided with tips or suggestions on how to optimize for the best settings.

Our solution is to allow the user to be able to track both their consumption rates while also being able to control their appliances. This dual approach is achieved by building our solution as an extension of Google Home’s existing mobile app and ecosystem. Google Home has a large audience range and market superiority in smart home products with support for over 50,000 smart home devices from over 5,500 popular brands which makes it an easy choice. We felt that Google Home’s expansive range of integrative products was the best platform for our solution.
To the existing Google Home mobile app, we added water and electricity consumption reports and energy-saving tips. The report screen provides an overview of consumption and costs, with different graphs that the user can filter between and a breakdown per smart home product to provide a deeper analysis. Tips are prompted to the user to optimize smart home products in an effort to reduce the consumption of water and electricity while saving money for the user.
View the challenge prompt here
The Problem
Smart home products are changing our lives. By 2021, 1 in 4 of all households in the US will be fully smart homes.
7 in 10 households in the US now own at least one smart home product. That translates to 83 million households and of those, 18% or 22 million homes own more than one smart home product.
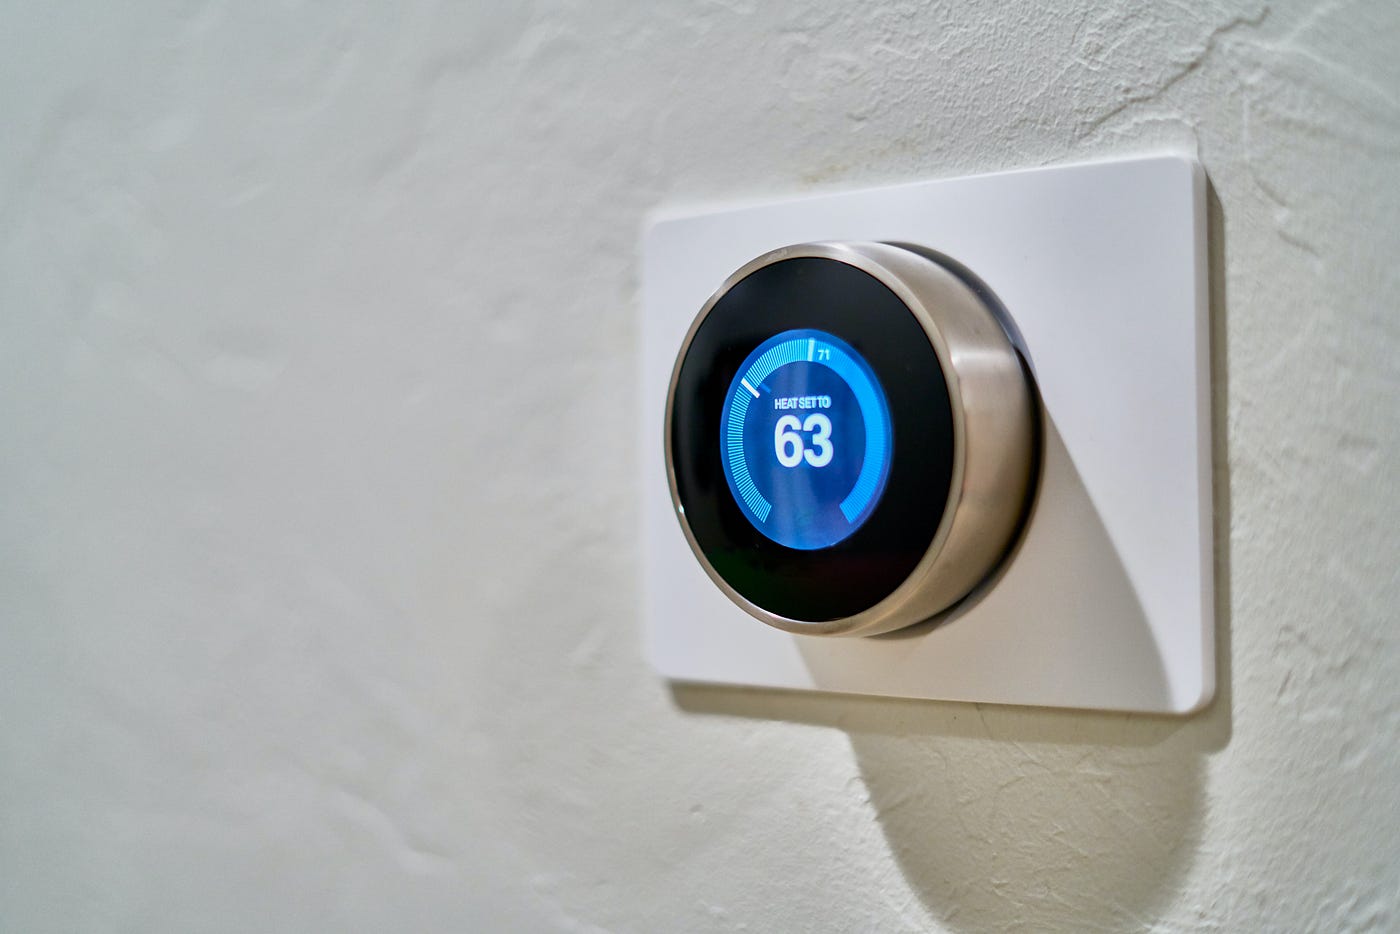
Smart homes can save up to 30–40% of energy based on different settings by optimizing the smart home products that are used in the homes. Smart home products also help with cost savings — with a smart thermostat saving up to $180 a year alone. With an increasing impact smart homes have in our communities and daily lives, it’s important for users to understand how to better optimize their smart home products to get the best outcome for their homes.
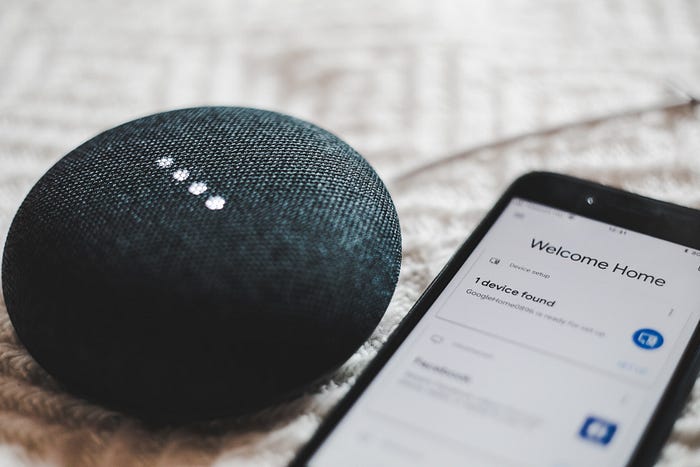
To control smart home products, millions of people have chosen to use the Google Home mobile app to control and manage products for their smart homes.
The problem is, smart home users do not receive reports on detailed consumption rates of utilities on these appliances through the Google Home mobile app. If a user wants to learn how much they are spending per smart home product or want to learn how much energy a particular product is using, there is no screen that provides a quick summary.
In addition, there are no opportunities to learn how to reduce the consumption of utilities. If a user wants to learn how to save money or energy through optimizing their smart home products, there are no tips or suggestions that provide this opportunity at the moment through the Google Home mobile app.
This is where we found an opportunity to help smarthome users around the world.
As a team, we decided to tackle this problem because we were drawn to the opportunity to work intentionally with data visualization. At the same time, we felt that the growing prominence of smart home devices made this challenge extremely relevant to explore.
Problem Statement
How might we allow smarthome users to see data reports of their smart home products at a glance and also learn how to better optimize their smart home products to reduce their consumption?
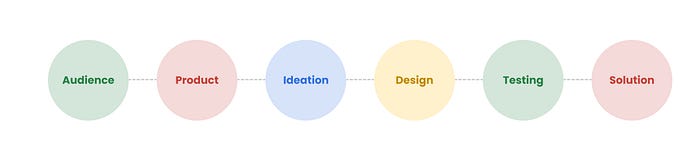
Design Process
Audience
44% of smart home tech adopters are parents with children younger than 18 years of age.
We conducted semi-structured interviews with working parents that are also new to parenthood. We chose new parents as our demographic because we understood that they are trying to adjust and adapt to new tasks, schedules, and tools with the introduction of a new child in their lives.
As new parents, they are often integrating new smart home products to make their daily lives and managing their children’s lives a lot easier, so there’s the knowledge that parents are more likely to rely heavily on smart home appliances. Our goals during our interviews were to:
- Understand their behaviour with smart home products
- Dive deeper into the problems users with smart home products encounter when trying to understand data and optimize their appliances
Children often encourage their parents to purchase new types of technology. At the same time, parents of young children are more likely to invest in smart house devices, due to the security and safety benefits.
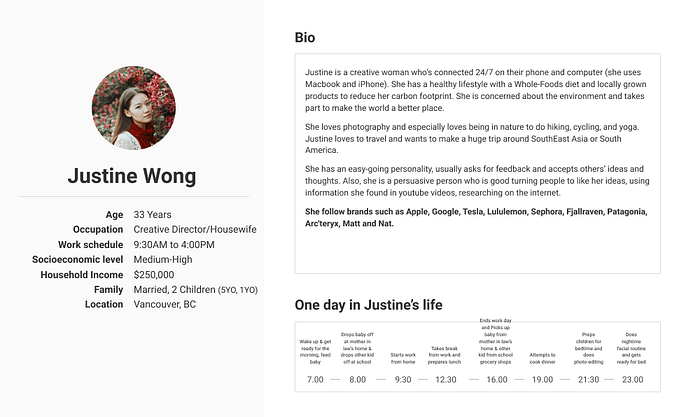
Meet Justine Wong.
She is a busy creative living in Vancouver with her two young children along with her partner. Together the family of four bought a home last year and have swapped out old appliances for newer products that fit their ideal goal of converting their home into a 100% smart home. As a recent parent, she’s learning more about the expenses needed to support both her current lifestyle, work, and children’s needs. Because of her work and interest in sustainability, she’s committed to finding ways to reduce her carbon footprint.
One day, she notices that her utility bills are higher than normal for the month.
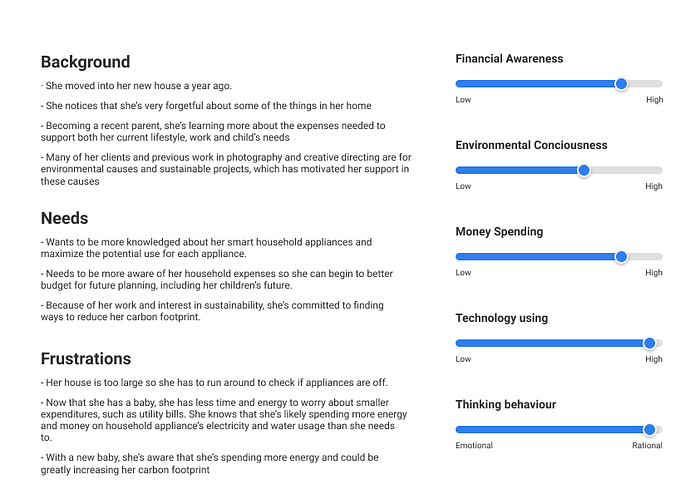
However, her utility bill doesn’t break down what was the cause, and being a recent mother of two, she has less time and energy to investigate properly into this. She’s frustrated because she has a lot of smart home products in the house but they currently don’t provide any data on usage. She’s also frustrated because she wants to be more knowledgeable about her smart home products to maximize the potential use for each appliance but she has no time to sit down to do this.
“I would like to have one app that connects all smart home products such as thermostat, security alarm, etc., to see how much money I am saving.”
😢 Justine has three key pain points:
- “I can’t find any data on how much energy my smart home products consume!”
- “I want to see if our family used more energy this week compared to last week.”
- “How do I manage my smart home appliances to reduce my consumption?”
😄 Here is how we will help Justine.
- Easy to digest reporting screen integrated into the Google Home mobile app
- Detailed usage reports filtered by different views and smart home products
- Tips on how to optimize smart home products to reduce consumption
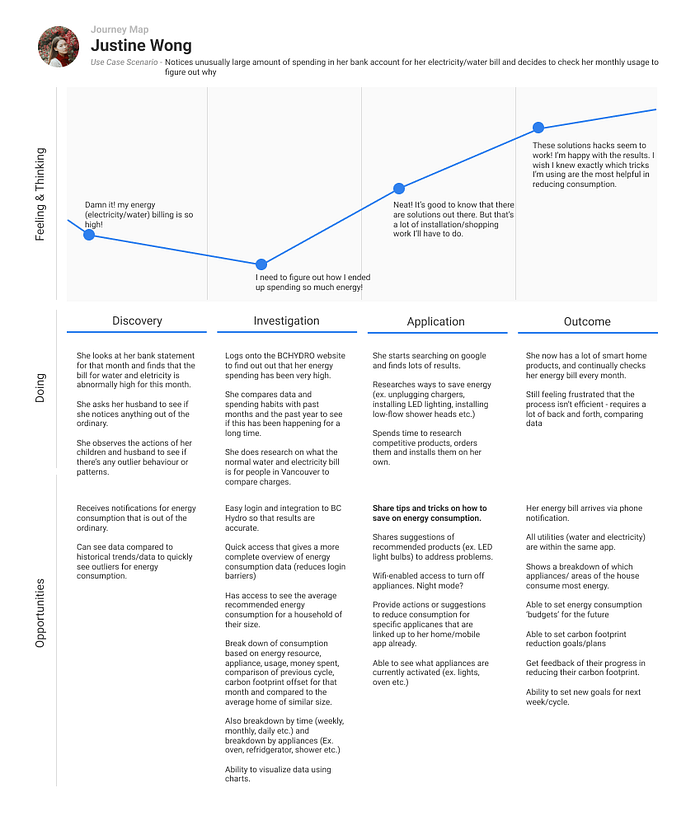
A user journey map was then created, including her thoughts and feelings following a scenario where Justine notices a concerningly large electricity and water bill this month prompting her to investigate. From this, we were able to visualize Justine’s areas of frustrations and create opportunities in the problem space.
💡 User Insights
Motivated to focus on usage: Being a parent often results in high-energy and water consumption usage, which motivates much of our user’s attention to this area.
Quick access: Users are seeking a seamless way to quickly access, view, and implement strategies to better manage their energy and water consumption.
Making a positive impact: A combined interest in environmental impact is key for someone who is socially conscious like Justine, as they are not motivated simply with the interest of reducing costs but also to feel impactful with their choices.
Do more tasks, in less time: The primary audience is someone who’s already opted in smart home appliances and their ecosystems because of the convenience it brings as a busy working mother of two.
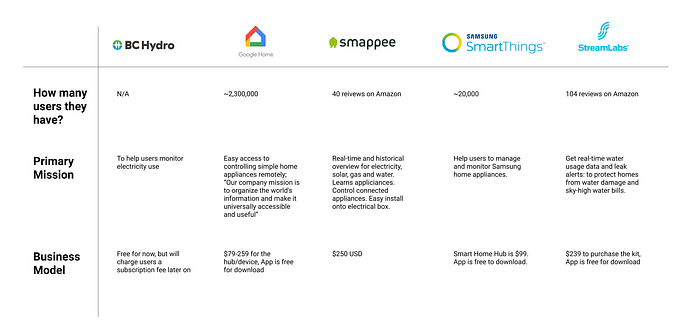
Competitive Analysis of Products
Analyzing other current products and solutions provided opportunity spaces where our feature for the Google Home mobile app can fill the gaps. We gathered data on competitive products and noted their approximate consumer size, core objectives, and business models.
Problems being solved
- Users can connect their smart home products to individual mobile apps to manage and control settings.
Problems being ignored
- Users do not have any reporting screen in the Google Home mobile app to view a summary of their energy consumption.
- Users have no way to find out how much they are consuming per smart home appliance, and how much each cost — did any of the appliances use more electricity compared to last month?
- There is a distinct gap between products that simply tracked utility consumption (through an externally installed device) and products that primarily controlled the activation of smart appliances.
The rise of new problems
- As users connect more smart home products to their homes, they have less time and knowledge on how to optimize their products to reduce consumption in water and electricity.
- With more smart home products being connected in each household, the need for a centralized mobile app to both manage and see data is needed for a seamless experience for users.
You might also think — Why not check my utility bill? Here’s the problem with conventional utility bills.
To access data that uncovers energy usage, most users will have to log on separately to their electricity or water provider's platforms to view this information.
We want to eliminate this problem by creating a more seamless approach, where the user can simultaneously view their electricity and water consumption in real-time while also being able to apply and control their smart home appliances without having to leave and visit another application or website.
Ideation
Drawing references from the competitive products, we began ideating solutions we felt would best address our user, Justine’s needs. From the pool of feature ideas we created, we then organized them through an affinity mapping process to determine any common themes.
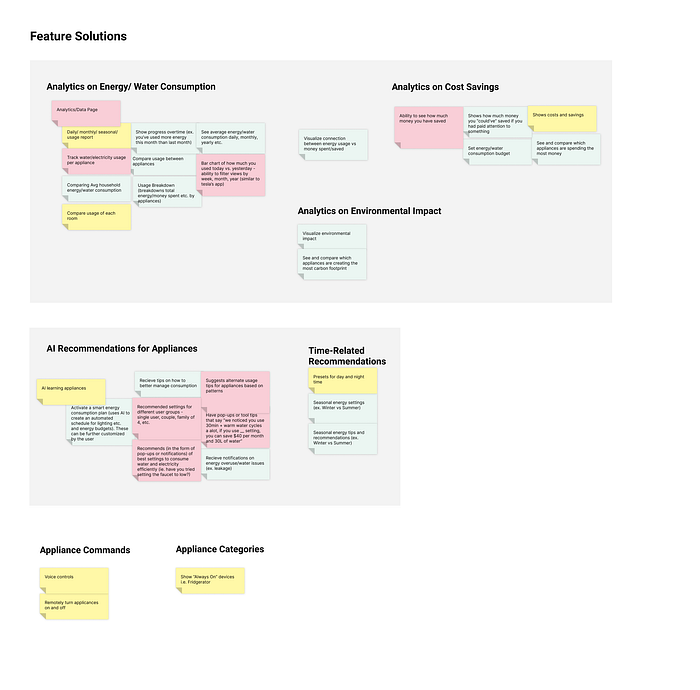
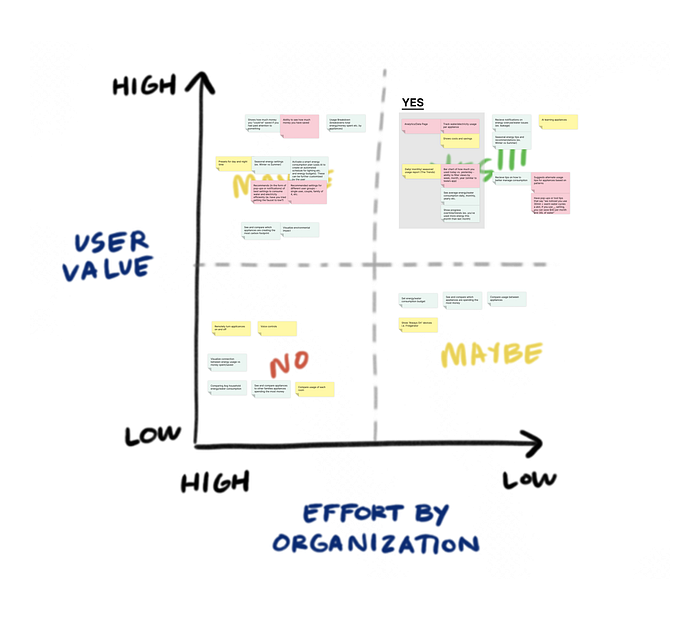
From there, we plotted each of these features on a Prioritization Matrix to gauge the features that were most pertinent and viable for both user value and organization efforts.
💡 Insights
- The key feature to focus on is data visualizing the electricity and water consumption of appliances while detailing its related costs and historical trends.
- It’s optimal for the user to combine both the ability to track electricity and water consumption with the ability to control their respective devices.
- Integrating a reporting feature to an existing smart home product is the best solution to take advantage of its ability to remotely control and automate smart appliances.
- The Google Home mobile app was the most optimal as we noticed their large loyal consumer base.
User Story and Task Flow
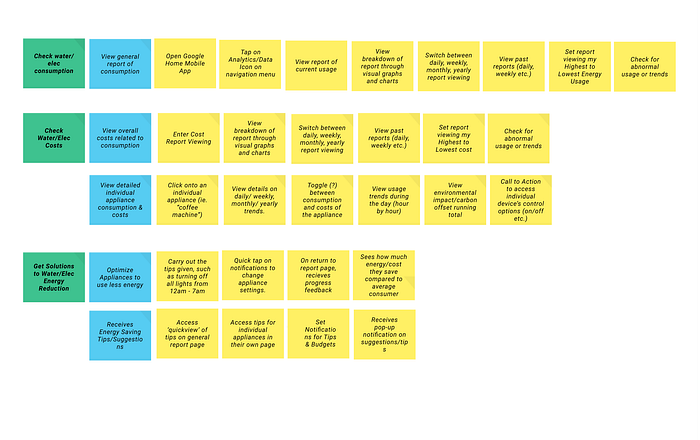
Task flows and task analysis were performed to ensure that for each major task that the correct information and interface elements and components were present to allow the user to successfully complete that specific task. This helped create the foundation for user interface elements that needed to be created and information that needed to be displayed.
As a mother of two who relies on smart home appliances, I want to better manage these appliances so that I can be even more efficient with my time and money.
Design Requirements
Ultimately, we identified a list of design requirements to address the design problem. Most notably, the solution needs to:
- Assist users to easily digest usage and financial details related to their energy consumption habits
- Provide non-intrusive nudges for users to help reduce water and electricity consumption
- Flexibility to view detailed breakdown per energy and water resource with each smart home product
Design
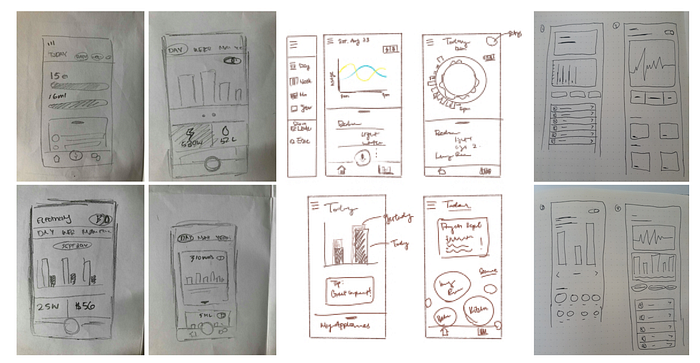
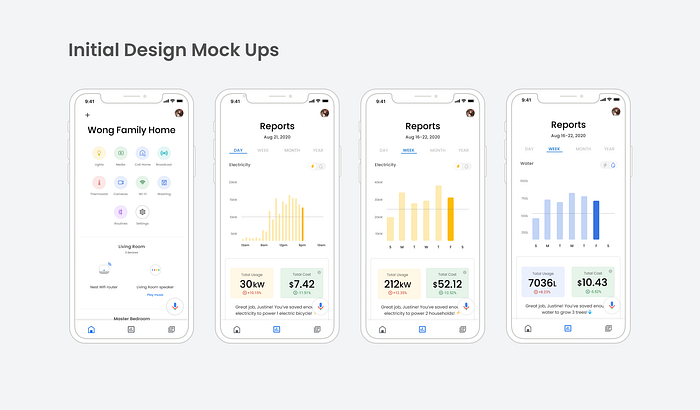
To begin, we conducted crazy eights individually to diverge and then converge on our ideas and sketches. Wireframes were created to identify any missing components for screens. The screens were then created digitally and prototyped in order to conduct cognitive walkthrough tests and to reiterate on the design before moving onto the high fidelity mockups.
💡 Thinking process from the team:
- Summary of both energy consumption and expenses should be the main view
- Detailed views of smart home appliances while is important, is less of a priority to showcase and thus could be placed in a card further down
- Tips on reducing water and electricity consumption should be basic and easy to understand without getting in the way of the user
Testing
We used our initial designs to conduct heuristic usability tests with users to see what user flows and design could be improved upon.
💡 User Test Insights
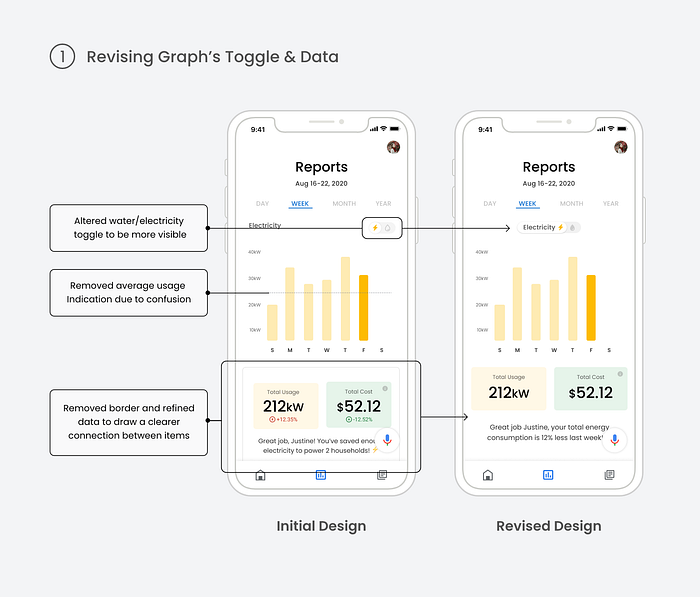
- For some users, it seems that there is only an electricity report and no other view. The toggle to view the water report is difficult to discover.
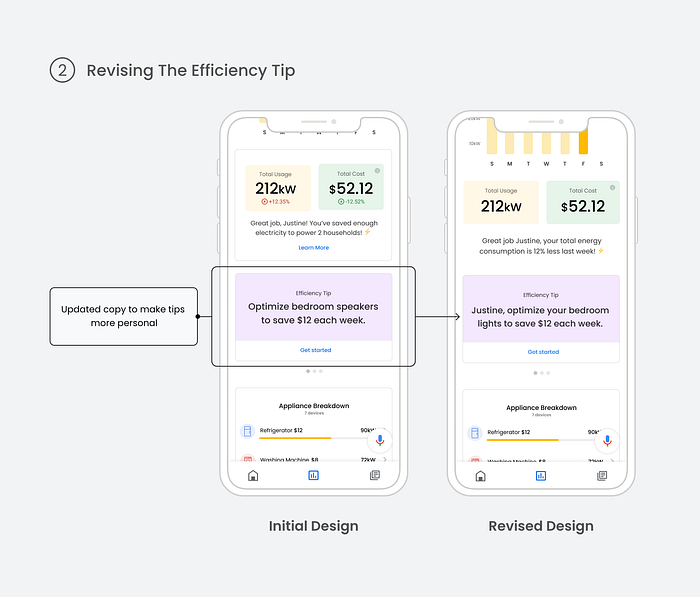
- The efficiency tip was confusing for some users, as it didn’t provide meaningful nor direct actions for the user.
- The environmental feedback card was misleading and confusing, and users felt there was a disconnect as there doesn’t appear to be any connection about it on the graph or to anything else on the reporting screen.
Iterations
Based on the feedback and insights from user tests, we made the following refinements that would allow our users to be able to view the different energy reports easily, as well as understand their environmental impact and how to optimize their smart home products.
Solution
We designed a reporting screen for the Google Home mobile app that provides users with the ability to understand their usage and costs as well as providing the flexibility to dive deeper into each smart home appliance to understand more.
As determined from the research, receiving data and analytics about smart home appliances in a centralized location is important for most users. By integrating a reporting screen into the existing Google Home mobile app we can allow users to have a summary view of the energy consumption, costs associated, and a visual representation of the consumption. This allows users to receive information that is important at a quick glance without a steep learning curve. Different views between electricity and water ensure that the user can see their consumption per energy resource without getting mixed up or confused about what data they are looking at.
Some users may want to view the breakdown of consumption and costs per smart home appliance, so to ensure full transparency there is a section on the reporting screen where users can expand to see more of the data on specific smart home appliances. The appliance breakdown doesn’t require a steep learning curve as well, both catering to beginner users and power users of Google Home.
With trying to balance both work and a growing family, having the ability to optimize settings for smart home appliances to reduce consumption in electricity and water is helpful to ensure a positive impact is being made through the use of smart home appliances. With little time and energy to understand how to optimize, having the tips as cards allow users to think less and save more. By enabling users to quickly understand what changes they can make and how much money or energy they can save, this allows users to make a quick and easy decision on whether or not to optimize for the best setting without users to think about what the outcome would be.

Conclusion
Learnings
This was the first time our group completed a design sprint fully remote, so we learned a lot in terms of collaboration and working quickly through online tools. Communicating without being in person was also different but we learned how to communicate asynchronously and also collaboratively through this design sprint.
We also learned how to work with a design library, as we had to adhere to the design guidelines and principles set out by Google and stick to the same typography, design elements, and content format. This was a fun process for all of us and took some of the stress and pain from designing colour palettes and finding a typeface from scratch.
The challenge focused heavily on building a feature in an existing mobile app and this was something all of us never attempted before in a project. Because we do not work at Google nor know the in-depth business goals and roadmap for Google, there were some assumptions to be made when designing this feature for the Google Home product. So to design and build a feature with these constraints was a unique challenge for us, and although we may not know all the business goals for Google, we learned that it is okay to make assumptions and to build features for existing products.
Next steps
If we had more time for the project, we would like to spend more time on user testing. Because we were all working remotely and with the implications of COVID-19, we did not have as much exposure or ability to conduct user testing in person to receive the rich feedback we would have otherwise in a normal setting.
Thank you for reading!
Team Members and Roles
- Gavin Liang — UX/UI Designer
- Kimberly Leung — UX/UI Designer
- Peter Ip — UX/UI Designer