Member-only story
How ChatGPT can help enhance your design documentation process
ChatGPT creates amazing first drafts of design documentation

ChatGPT won’t create design documentation for you, but it can quickly generate a great first draft.
Despite creating a weekly UX article for the past two years, creating design documentation isn’t my favorite task. It often involves flipping between a Figma file and a Word editor, deep research into formatting, and much more.
So when I needed to write design documentation to help designers understand when and how to use Data Visualization, I tried to see if ChatGPT could do the heavy lifting.
If you’re not aware, ChatGPT is a Generative AI tool sweeping the internet with how quickly it can generate code, write essays, and, in this case, write documentation.
However, was it suitable for Design Documentation? Sort of. Here’s what works and doesn’t work with using ChatGPT for design documentation.
ChatGPT is excellent for creating tables of data for documentation
One of the best parts about ChatGPT is the ability to create a data table that fills in different states, palettes, and more.
This sounds like a minor deal, but it’s a huge timesaver. For example, let’s say I needed to create a color palette that shows how a component looks in the following states:
- Default
- Hover
- Clicked
- Active
- Focused
- Disabled
I also don’t just want this for one color. I want this for three:
- Background Color
- Border Color
- Text Color
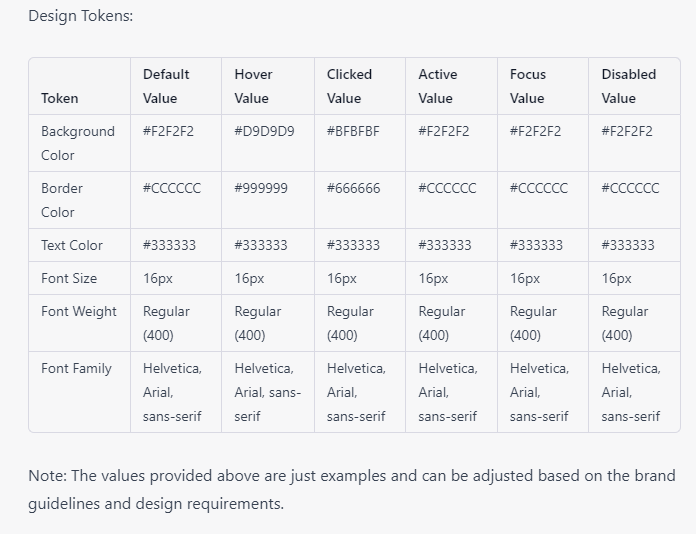
ChatGPT can generate those 18 cells of relevant data rather than me flipping back and forth between a Figma file and puzzling about what I should fill into each cell.