Member-only story
How to Measure Design System Adoption
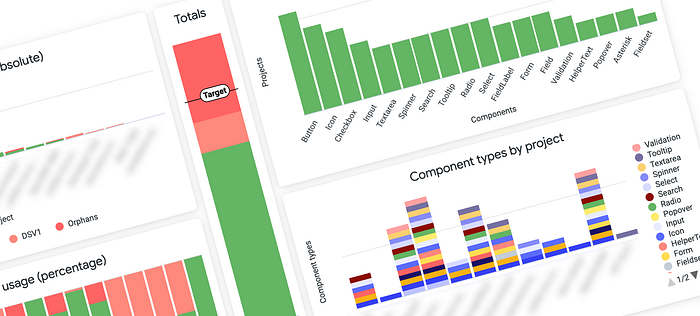
Automated tracking of token and component adoption
Early on in Onfido’s design system journey all our data and metrics were manually collected. We were a scrappy team without dedicated resources, and we did what we could within those constraints.
The data we collected during this stage helped us to secure a budget and rebuild our design system to be better and more flexible. We had the bones of a great system that included design tokens, and around five high-quality components that we were convinced would be widely used if our product teams adopted them.
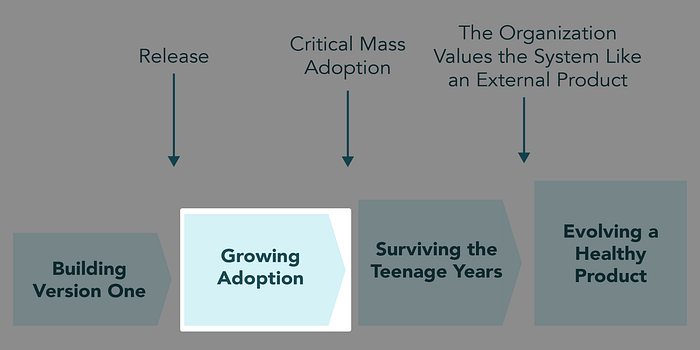
Each stage of design system maturity will have different metrics that make the most sense to track against your goals at the time. In this article, I’ll just be focussing on growing adoption.
Minimum viable integration
We started by having conversations with the three product teams we thought would get the most benefit from the system. The only blocker to adoption for them was the up-front effort to integrate the required libraries into their product. Once those libraries were in place, tokens or components…

