Member-only story
How to optimally organize information on the chart?
#28: Limiting the categories for clarity

People LOVE putting things into categories! If there is a lot of information, we will naturally create categories to make it easier to understand. This is one of the 100 things that every designer needs to know about people. Susan Weinschenk explains all of them in her book under the same title. What does it mean for us, the designers? In a nutshell, we should always organize information for our audience as much as possible. And while doing that, we should keep in mind the four-item rule.
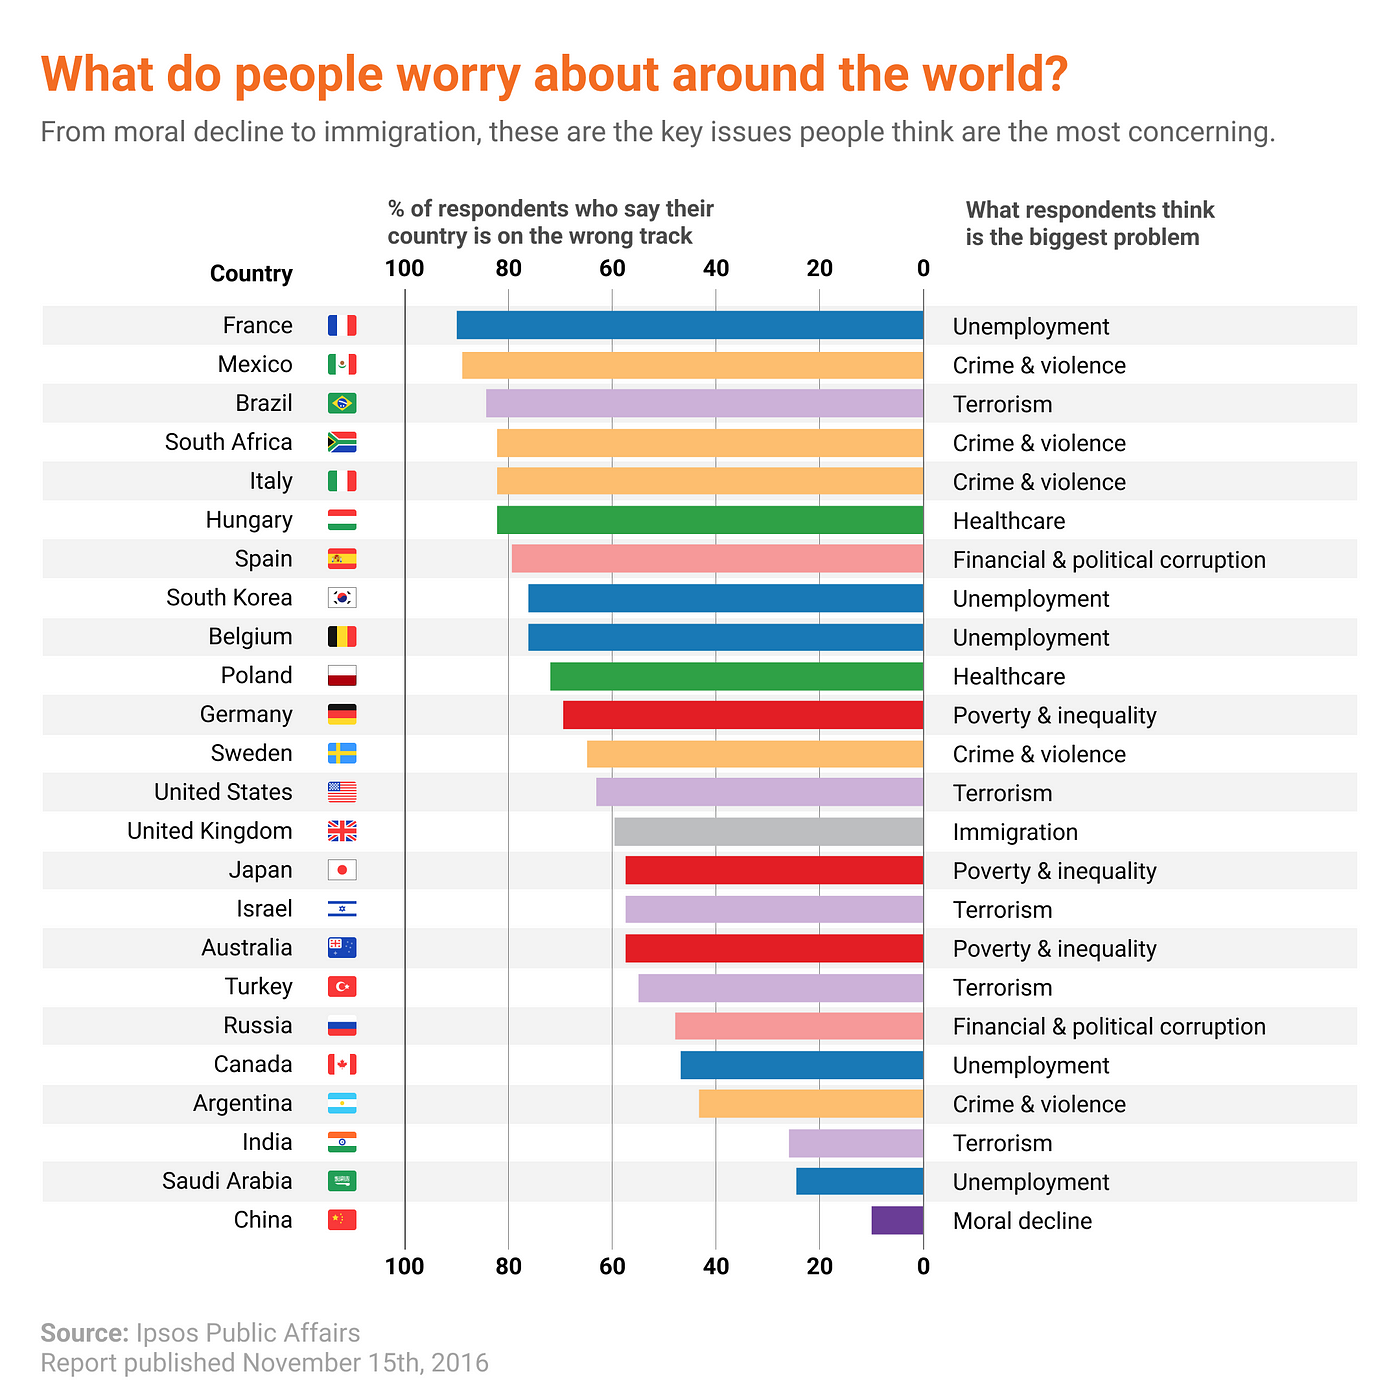
I’ll show you how to implement this using Radio Free Europe/Radio Liberty data visualization based on Ipsos Public Affairs publication. The chart focuses on what concerns people around the world — showing both the most concerning problem and the share of people believing that their country is on the wrong track. Conceptually, this is decent work, but we can improve a few areas.
Good data visualization solutions
Elements that work in this chart