Linking customer journey maps and blueprints to your objectives & key results (OKRs)
Key Questions: How do you measure the impact of an individual or team to the overall company vision? How do you align OKRs for experience design?
Proposed Framework: Link a customer’s journey map and your company’s service blueprint to identify points where you can improve efficiency and increase perceived value.
What are Journey Maps & Service Design Blueprints?
Journey maps & service design blueprints are visual alignment tools that get your different teams to communicate and see what you’re doing affects the overall company vision.
A great book to read about visual mapping is this book on Mapping Experiences by James Kalbach.
Here a very simplified example of how it might look like:

You can read more about how we did a workshop for journey maps and service blueprints in a leadership summit. (Note: I used platforms here instead of Props, which is what’s in Nielsen Norman Group’s Service Design 101 format. I was focusing on the technology part when we did this workshop.)
What are Objectives and Key Results (OKRs)?
A term made famous by John Doerr in the book “Measure what Matters”, this is an objectives alignment framework. The phrase he uses as a basic guide is:
I will _____________ as measured by ____________.
Phrased in another way, it could go as:
If we are successful with ________, we will have more ________ and/or less __________
Two components of the OKR are:
- Objectives are memorable qualitative descriptions of what you want to achieve. Objectives should be short, inspirational and engaging. An Objective should motivate and challenge the team.
- Key Results are a set of metrics that measure your progress towards the Objective. For each Objective, you should have a set of 2 to 5 Key Results. More than that and no one will remember them.
OKRs are a goals alignment tool. A main OKR is set at the company level, then another set of OKRs are defined at the department level, then each employee writes an OKR that syncs with the department OKR.
OKRs must be focused. Define 3–5 key results from an objective.
I highly recommend Felipe Castro’s articles and Google’s re:Work for more info on OKRs.
Why Link Journey Maps, Service Design Blueprints?
To answer this, let’s go through some activities together and then go back to this question. Instead of me just telling you, let’s discover how it might be of value to you.
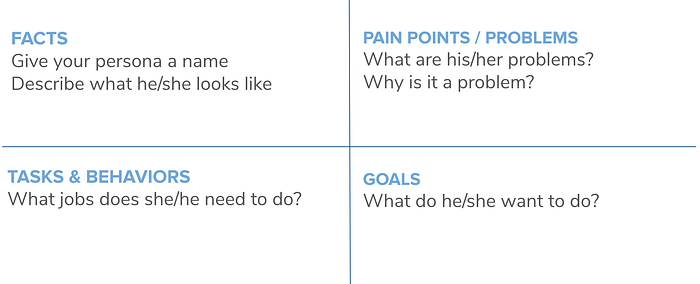
Step 1: Define who your customer is based on what you know.
Get a piece of paper (better yet, a notebook) and draw lines and add text so it looks like this:

Think of the business you are currently in. Try to answer who you think your customer based on the guide. Identify all the geographic, demographic, psychographic and behavioral points of your customer.
Complete your customer profile by also making another quadrant like the following:
Step 2: Define the main company/business objectives
I’ll assume you have a company objective already in place and doing these exercises should highlight whether what you are doing is aligned to the main goal.
There’s usually a big vision that your main stakeholders have defined and corresponding metrics along with it.
For this example, we define an education and advocacy based institution that organizes events and meetups. Following the OKR format mentioned earlier, here’s an example.
If we are successful with the institute, we will have more educated customers and gained revenue increase from X to Y.
Now go ahead and write your own main objectives.
Step 3: Map your customer’s journey
Let’s say we’re organizing an event for the educational institution. Our persona is a student named Laura. Our objective is to educate people like Laura through an event or meet-up. We make assumptions on what we think Laura’s journey will be. Here’s an example of how that might look like:

Step 4: Map the services that support the customer’s journey.
Now that we’ve mapped Laura’s assumed journey, we look at the processes that would support the journey. Do the same in your own notebook.
STEP 4A: Identify what Laura will see and interact with. Focus on areas that represent your brand. It must be controlled or by you or your team. Make sure they are aligned with each part of the users journey.

STEP 4B: Identify who manages each touchpoint.
Write who is in-charge of each touch point that your persona would interact with. Example: Laura will see our event through the facebook page. Well, who’s in charge of managing the facebook page? Write down the roles.

Ideally, write the name of an actual person.

Sometimes the goal is at the department or team level. If so, write the team/department name
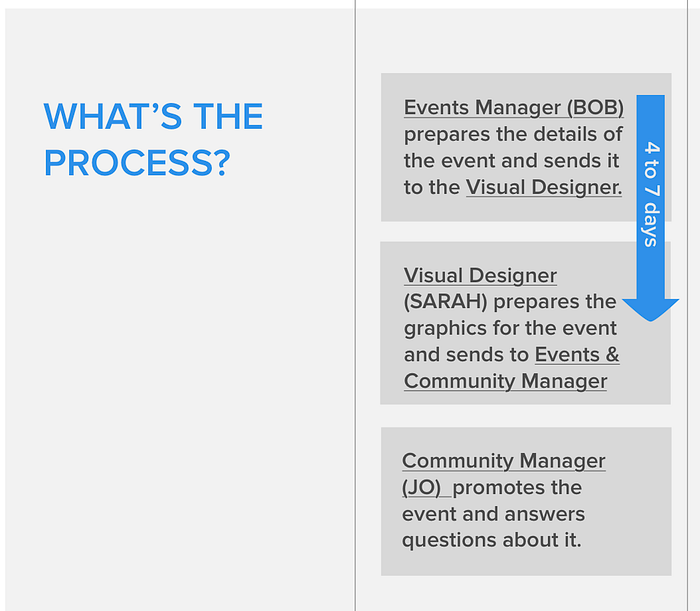
STEP 4C: Identify what are the processes/tasks that are done by the people responsible.
In our simple example, there are several tasks that’s involved to support Laura’s journey. An events manager will find a venue sponsor and the reserve the time and place. He will give these details to a visual person in marketing to make a poster. The poster is then shared by the community manager in the Facebook group.

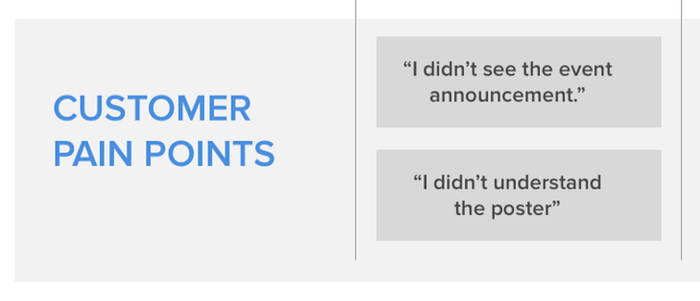
STEP 4D (OPTIONAL): Include the pain points that customers have mentioned on each touch point.
You may have had feedback on your other previous initiatives. In our example, we write down the comments made by previous participants.

Step 5: Identify Opportunities.
Review your customer journey and business process blueprint and check if there are better options, faster ways, and improved value. Then make sure you are giving sufficient feedback on each touchpoint.
Google’s HEART framework with signals & metrics may be useful here.


Going through the journey maps and service blueprints, however, I’ve personally found the following patterns that seem to always come up.
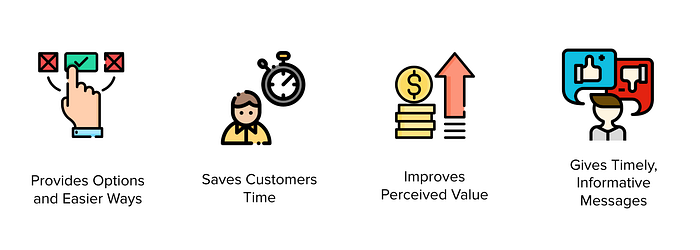
BETTER OPTIONS/EASIER WAYS: Do we provide better options or easier ways for customers?
Are you giving your target persona a better, quality choice? Do they reach you in the appropriate marketing channels?
In our example, we’ve notice we only advertise the events in twitter and facebook, should we open up to other channels? Do we measure the performance of the new channel versus the previous ones?

Possible team OKRs: Increase number of conversions from new marketing channels like instagram from X to Y for the next event.
TIME BASED OPPORTUNITIES: Can it be faster and can we save time for customers?
Check out how long it takes to process certain tasks. Ask yourself:
- Why it takes that long?
- Can it be regularly measured?
- Is there an opportunity to shorten it?
In our internal processes, we also see that it takes 4–7 days before a design is finished. It can it be done faster?
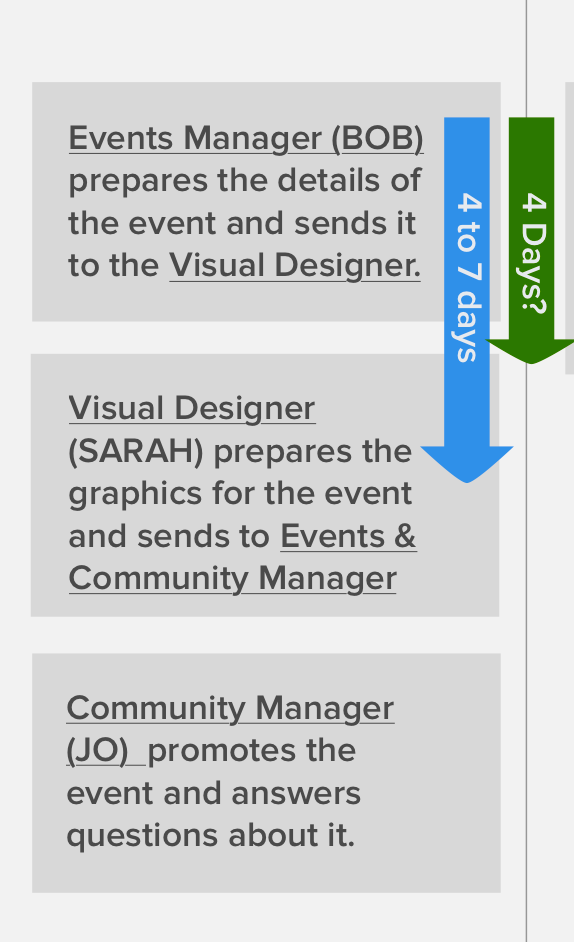
Possible Individual OKR: Visual Designer to decrease time it takes to make visual marketing assets from X days to Y days.
VALUE BASED OPPORTUNITIES: Can it be better?
At this point we ask questions like:
- Are customers getting what they pay for?
- How does it compare to competitive rates?
- Can you give better perceived pricing or rates?
- Can the design quality be better?
- Do our marketing posters entice clicks?
If this was a paid event, are we priced competitively? In our marketing materials, how many customer clicked on these?
How about our net promoter score? Can it be improved?
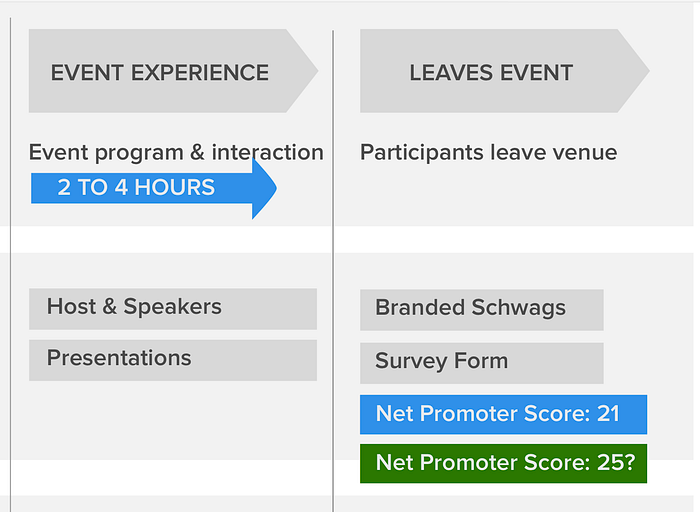
Possible Team OKR: Improve net promoter score from X to Y.
How about our customer pains? Did we analyze and think about how we might be able to track this?
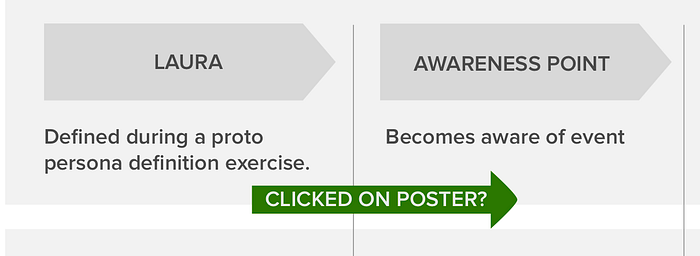
Possible Visual Designer OKR: Improve clicks from visual marketing designs from X (previous design clicks) to Y.
TIMELY FEEDBACK: Do you answer questions quickly?
Is your team able to respond to inquiries within a given time frame? Can your chat flow be automated? Do customers see your notifications? Are the messages in time for customers to make decisions?
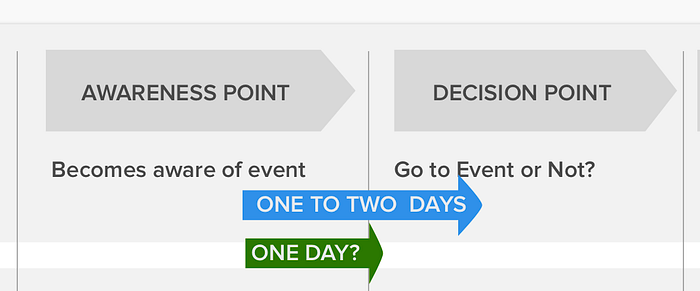
Here we see our persona, Laura, take one to two days before making a decision to go or not. What’s the cause of her delay? Are we responding quickly to her questions?
Possible Team OKR: Decrease response times to inquiries from X to Y .
Revisit your Objective/s
Look at your company or business objectives and revisit where in the customer’s journey and business process can be measured. Figure out which ones can be improved from X to Y by team and individual.
Examples:
- Increase number of conversions from new marketing channels like instagram from X to Y within the next 3 months.
- Decrease time it takes to make visual marketing assets from X days to Y days.
- Improve clicks from visual marketing designs from X (previous design clicks) to Y.
- Improve net promoter score from X to Y.
- Decrease response time for inquiries from X days to Y hours.
If we were to follow the broad overall OKR format, then it would look like this:
If we are successful with the event, we will have more clicks from instagram, take less time to make visual designs, get more clicks to our posters, get more referrals and take less time to answer inquiry questions.
Was this exercise useful for you?
What do you think? Were you able to identify points for improvement within the customer’s journey or in the service blueprint? Are you able to link it to your business objectives?
IMPORTANT REMINDERS:
The visual map needs to be further validated with design research. Qualitative feedback and surveys give more insights to the overall process.
This exercise achieves better results when conducted as part of a design sprint. Around 3–7 key people and a couple of decision makers would ideally be part of the mapping process. They can give feedback, correct, realign, adjust the maps & so on. Remember that the goal is to have a common understanding of the processes.
Try this in your next workshop and give me feedback, will you? Share what works for you and how you would tweak the exercise.
Personal Note:
I’ve been doing this almost daily for various businesses and their departments for the past months. This process has been extremely helpful. It somehow illuminates client’s minds when they see what it takes to support their customers. There’s always someone taking a picture of the white boards after our sessions. Hope this helps you as well.