Mind maps & UX design

Design = Visualizing a solution.
The Italian verb disegnare in 16c. developed the senses “to contrive, plot, intend,” and “to draw, paint, embroider, etc.” French took both these senses from Italian, in different forms, and passed them on to English, which uses design in all senses.
As the Etymology of the word points out, the act of designing is the act of contriving a solution and to give it a shape, a visualization. This happens in every Design disciplines, like Industrial Design, Service Design and of curse Ux Design. All areas where visualization tools are fundamental because of their communication power.
What a Mind Map is.
One of the powerful tools we have as Designers to understand, define and communicate ideas is the Mind Map, currently a broad term that identifies a visual representation of a sequence of thoughts, a concept, a system or a process.
Depending from the context and from the final goal, these kinds of visual representations can come in different versions, but at their basics, they are made of words and connecting lines: the first ones represent the objects, the second ones represent the relations between the objects.
They enable us to focus on the high-level idea without caring too much about the small details, they keep alive the creative flow with a fluid process letting the concepts emerge from it. Unlike in standardized visual representations (e.g. UML diagrams), the relations between the objects here are often generic and not codified, indeed with a simple line, we can represent a parent-child relation, a cause-effect relation or even a chronological relation.
Why to use Mind Maps.
A Mind Map in a Design process can have 3 main purposes:

1) It can materialize the concepts and make their characteristics more explicit: it reveals hidden clusters, patterns and entities, it makes them more clear and more understandable.

2) It can become a live document upon which a whole team can collaborate in a brainstorm way: redrawing, editing and expanding it, adding new concepts, making the map growing together in an attempt to explore all possible solutions to a given problem.

3) It can describe a process or a model in an easy way, explaining its basic mechanics and highlighting its real value.
How to draw them.
The Tree Model
Most of the Mind Maps follow the Tree Model: they start from a single object, often positioned in the center and they then develop several branches that represent related concepts. Each branch can split into two or more branches but they never merge together: the whole map is a hierarchic scheme where each object has only one “parent” but can have multiple “child”.
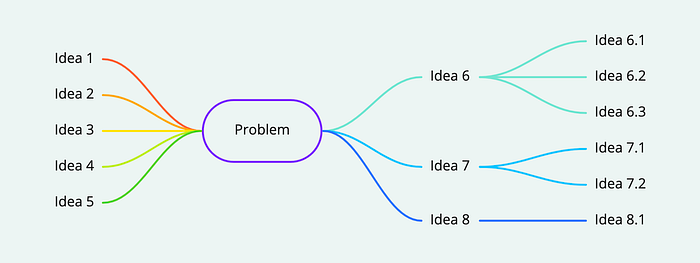
Because of its low complexity, this Model is fast and easy to manage, but sometimes the constraint of hierarchical relations doesn’t allow a meaningful representation: sometimes we need more flexibility.
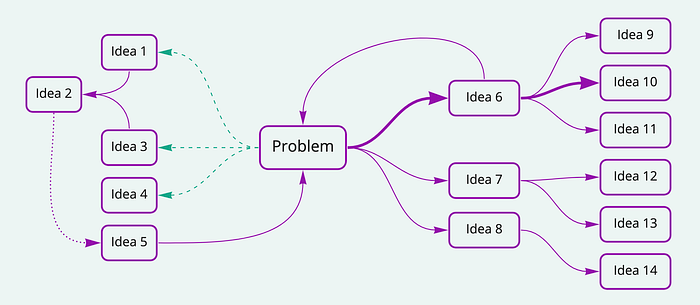
The Graph Model
Another common model is the Graph, which is indeed similar to a Tree Model but with some power-up. First of all, any object can be connected to any other object so that the hierarchical structure is no more present. Secondly the connecting lines can have a dimension, a direction, and even a basic codification.
A real example of a Graph Model is the Map of Music Style, where the affinity relations between the music genres are showed with curved lines. In this case, also the objects have a dimension.
Graph Model can be very sophisticated and sometimes it can drive us in really complicated thoughts, trying to maintain a perfect coherence within the elements we are drawing. It’s important to keep in mind that a creative process works better when it’s progressive: we define the macro-level of the idea, its perimeter, and only after that we can start the refinement at the micro-level, through many iterative cycles.
Indeed, drawing a Mind Map at the micro-level can be really hard and is often useless. Overall during the early design phases, it’s more productive to create Lo-Fi maps instead of wasting time in detailing and codifying them.
A Mind Map for UX Designers
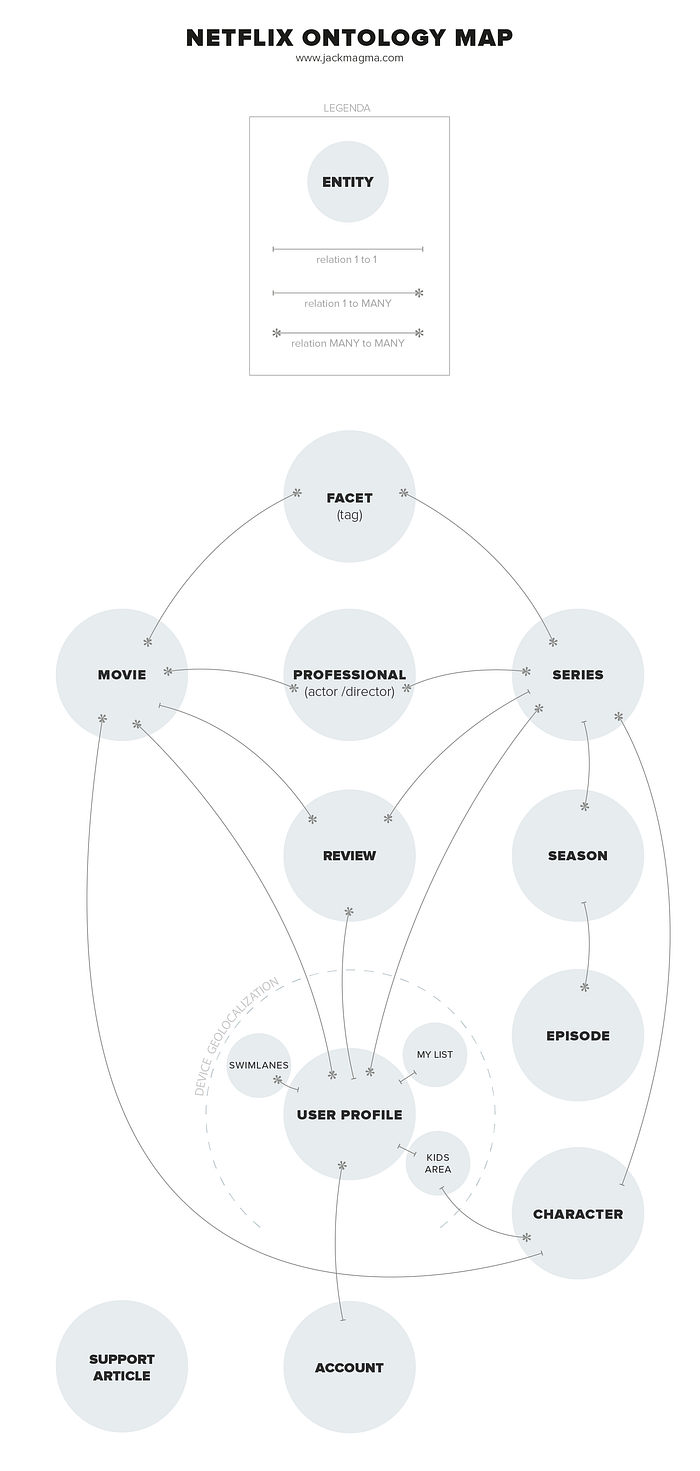
As seen, Mind Maps are a tools for brainstorming, patterns recognition and processes visualization, so there are endless way a Mind Map can help us in our UX design work. But I found one kind of Mind Map specifically useful to us because it shows the entities and the way we are connecting them: the Ontology Map.
Ontology is the philosophical study of being, it studies concepts that directly relate to being as well as the basic categories of being and their relations.
Ontology Map has some similarities with the Database Relationship Diagram used by developers and indeed they have the same goal: they want to represent the relations between the existing objects of the system. Nevertheless, the Ontology Map is more often a design tool than a documentation tool, so we use it mainly in the early stages of the project to help us define how the system could work.
Some few more advices
For my projects, I usually draw this map the day zero, sometimes during the kickoff workshop with the client, because it helps everybody to be on the same page and it gives the chance to finger-point something concrete during the meeting’s discussion (don’t underestimate this!).
If you never draw it, You should give it a try the next time you find yourself in one of these situations:
- You want to discover new features of the application you are working on. In this case, you can just try drawing new connections between entities or adding more entities in the equation.
- You want to create an overview of the service /software you are designing, showing how all its parts work together.
- You want to find edge cases and to detect critical global areas.
Keep in mind that it’s a live artifact and keep it updated within the project execution, in this way it can always support you during your brainstorming session and during the collaboration with developers and other non-designers professionals.
If you have more thoughts about the Ontology Map or the Mind Mapping in general, please reply with a comment to this article or feel free to contact me.
✌(‘ω’)