Member-only story
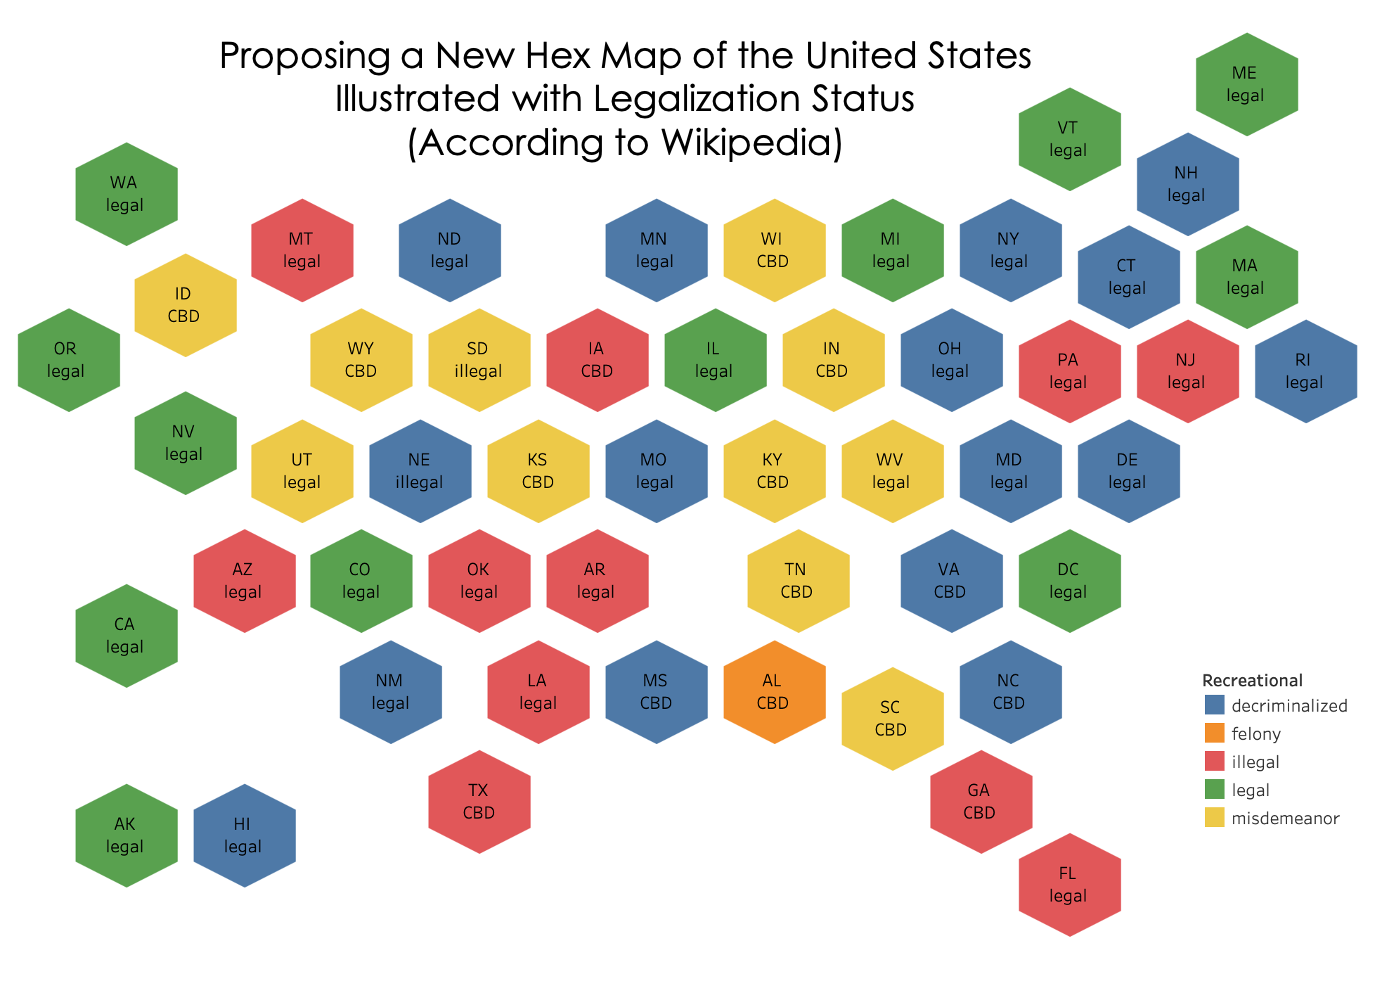
The case for a new hex US map layout — custom charting in tableau
 For whatever reason, maps are cool. Even though the earth has mostly been the same since those Pangaea days, we humans make and remake maps constantly. It might be that old maps remind us of how things used to be while new maps remind us of how fast things change. Maybe, it’s the geometric shapes and patterns that draw our attention to affect our psyche at a deep level.
The map’s dual mandate
Throughout our lives, maps often fulfill multiple needs as they straddle the line between art and science. On the one hand, maps are supposed to be a representation of the land — a precise account of the world’s geography. But on the other hand, people need to connect maps to understand what they have to say. Without connection, maps are no good and people are lost.
There was a time when it was understood that maps should be to scale, or in other words, the relative distances between illustrations on a map equaled the same distance between things on the ground.
However, when it makes sense, we stretch and skew maps to fit our needs. As a result, instead of a map with tangled spaghetti in the city center with long strands that stretch into the suburbs, we want an even distribution of information and art throughout the whole system.