The UX of value perception
Practical examples of creating more value through the components of the value equation.

The value equation
Did you know you see over 10,000 ads every single day? In the digital age, making your product stand out in the sea of competition is extremely difficult. The best approach is to figure out how to create value for your customers. But how do we define and measure value? A common misconception is that value equates to price. Good value means cheap, and bad value means expensive.
In actuality, the value equation proposed by Alex Hormozi paints a much clearer picture. The equation is composed of 4 parts: 1) the dream outcome you’re promising, 2) the perceived likelihood of achieving that outcome, 3) the time it is likely to take to achieve that outcome, and 4) the degree of effort required.
The top part of the creation ‘adds value’ and the bottom part of the equation ‘removes value’. A lot of businesses tend to be more biased towards adding value rather than reducing aspects of their business that removes value. This is actually the opposite of what we should be doing. It’s oftentimes much cheaper to fix gaps in the customer’s journey than it is to promise and deliver more.
For example, let’s say you own a company to make coffee machines. Adding value would be investing in research & development, creating more high-tech features, and improving the product’s reliability. All of these are costly engineering efforts. Instead, spending efforts on reducing the effort required like designing the product’s unboxing, setup, and onboarding experience is likely to also create a lot of value for a proportionally cheaper cost. In this article, I’ll break down the value equation and share specific examples of how to increase your product’s value across every dimension.
Dream outcome
The ‘dream outcome’ part of the value equation refers to how well your value proposition resonates with a problem your customer base has. Problems can be classified as “painkiller” or vitamin (although most startups focus on painkiller problems, vitamin problems can still make viable and profitable businesses). The best framework I’ve come across for understanding core problems is “JTBD (Job to Be Done)”. Assuming you understand what problem you’re solving and for whom, the best lever to focus on is your content strategy. This means the headlines and marketing content you use across all your ad campaigns and web pages should be framed around communicating your dream outcome.
For example, ‘Everydae’ is a learning platform. Their landing page headline is “Meet the world’s most sophisticated micro-learning platform”, which is not great for two reasons. First, there’s no problem being mentioned, finding the “world’s most sophisticated microlearning platform” is not a JTBD. Second, there’s no unique value proposition (being the “best” doesn’t count).
Making a few assumptions, a much better headline would be: “Earn your spot at your dream college with just 15 minutes of studying a day”. The JTBD is “I want to get admission to my dream college”, and the value proposition is “I can achieve this with less time and effort if I use this platform”.
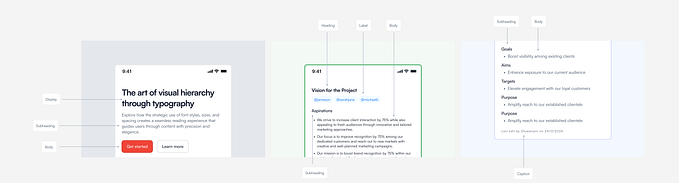
Here’s another example. Look at how a simple headline change drastically changes the perceived value of this product. The original headline just explained what the product is, but the new headline explains how it creates value and reflects their customer’s dream outcome.
The perceived likelihood of achieving that outcome
The ‘perceived likelihood’ part of the value equation refers to the likelihood of your business delivering on your value proposition. There are several factors that can influence the perceived trustworthiness of your product. The first tactic is evidence through metrics. In the example below (highlighted in orange), evidence is established through volume metrics: “millions of merchants worldwide”, and “$444b+ USD global economic activity”.
The second tactic is to show social proof, which often comes in three forms: 1) volume or users (or customers), e.g., “…millions of entrepreneurs”, 2) prestige of your customers (e.g., Crate&Barrel, Clek, Cluse, etc.), and 3) through testimonials, reviews, and success stories.
Perceived likelihood of success is a critical factor for customers choosing between products. If you had to get a haircut, would you choose an expert who’s cut hair 10,000 times or a trainee who’s cut hair less than 10 times? The dream outcome (a good haircut) is the same, but the perceived likelihood of achievement is higher with the expert, therefore his services would always be perceived as more valuable.
Time required
The ‘time required’ part of the value equation refers to “time-to-value (TTV)”, which is defined as the amount of time it takes for a customer or user to gain some sort of value from your product. It’s important to call out that the TTV isn’t the time to ‘dream outcome’, but rather the time to (any) value. Therefore, you should figure out how to deliver some form of value as early as possible in the customer’s journey. Ideally, you want to deliver value at specific increments, preferably, after they’ve completed desired actions (e.g. setting up their profile, creating UGC).
Throughout the entire pre-TTV customer journey, you should constantly look for opportunities to provide incremental value. Luckily, there are many opportunities within common time delays such as shipping times (physical goods), download times (digital goods), setup time, training time, implementation time, etc.
An example of condensing TTV for products with natural time delays is the “play as you download” functionality for mobile games. Normally, a video game like Genshin Impact would be a couple of GB and take up to 30 minutes to download. This would normally significantly decrease the perceived value of the game. However, with “play as you download” they can show a much smaller file size in the app store and then prompt the user to download the rest of the game as a patch after they’ve completed the first section of the game.
There are several common time delays in most B2B and B2C purchase flows. In B2B transactions, common time delays include credit checks, approval processes, and contract negotiations. In B2C transactions, common time delays include payment processing, shipping or delivery, and customer verification. Focusing on countering these time delays in the customer’s journey can be an easy way to add value for your customers. In some cases referencing speed in call-to-action (CTA) buttons, e.g., “Register in 5 Minutes” or “Get Started Now” have even improved click-through rates (CTR).
Effort required
The ‘effort required’ part of the value equation refers to the amount of friction required to successfully start using your product or service. There are two important factors to consider: 1) reducing customer friction, and 2) countering potential objections.
In terms of reducing customer friction, you must first understand the most common interaction costs associated with sign-up, setup, and switching. A great example of countering the ‘effort required’ switching costs objection of buying an iOS device as an Android user is the “Move to iOS” app.
Common mitigations for ‘effort required’ include 1) highlighting the ease of setup or installation, 2) showcasing simple and intuitive user interfaces with demos and mockups, and 3) countering objections around requirements (i.e., Get started — it’s free).
Another aspect of ‘effort’ is actually how the pricing model of your product or service is communicated on your landing page. In this context, you can consider money as a form of ‘stored effort’. Therefore highlighting things like generous refund policies, free trials, money-back guarantees, try-to-buy, etc. also has an impact on reducing the perceived effort required. In the Webflow landing page example above, the text underlined in yellow addresses various ‘effort required’ objections.
These tactics remove some of the risks for the customer and increase the perceived likelihood that the product or service will meet their expectations. It also has the added benefit of activating the ‘Endowment Effect’, which is a concept in loss aversion psychology in which people tend to value things more highly simply because they own them. Therefore, when a customer uses a product or service for a period of time during their trial, they become more attached to it and are more likely to purchase it in the future.
Countering potential objections is a common approach to structuring landing pages; each section corresponds to a customer objection. Imagine what the most indecisive, hesitant, and skeptical customer might ‘object’ to when you attempt to sell them your product or service. You might hear things like: “it’s too expensive”, “will this actually work?”, “how long until I start seeing benefits?”, “do you offer refunds?”, etc. Your headlines and marketing content should all be framed around countering a specific objection your customer may have. This is why every landing page has multiple conversion points: in the hero section (for prospects who are sold by the headline), on the sticky navigation bar (for prospects who are sold midway), and at the bottom of the page (for the skeptics finally convinced).
Conclusion
In conclusion, instead of attempting to “improve the product” in general, you should examine your product along the four components of the value equation. The first component, the dream outcome, refers to the customer’s “Job to Be Done (JTBD)”. This is the state that your customer wishes to achieve, i.e., studying at their dream college vs. using the world’s most sophisticated microlearning platform. The second component, perceived likelihood of achieving the outcome, refers to the customer’s trust in the ability of the product to deliver on the promised dream outcome and value proposition. The third component, the time required to achieve the outcome, refers to your product’s “time-to-value (TTV)”. Finally, the fourth component, the degree of effort required, refers to the amount of friction before their TTV and if their objections have been handled. After completing this exercise, you should consider making a list of ideas for each component. Afterward, execute them based on ideas that have the highest return on investment (highest impact, lowest cost).
Ready to level up your design skills and reach your full potential? Subscribe to The Ambitious Designer newsletter for weekly doses of UX insights, frameworks, and practical career advice.