You're reading for free via Tanzir Rahman's Friend Link. Become a member to access the best of Medium.
Member-only story
Two easy methods to design surveys for complex problems
Conjoint analysis & Max-diff

The typical bootstrapped startup or product team goes about surveying users by… identifying a problem > qualifying users (who to interview) > designing categorical, ranking/rating/scaling and open-ended questions > then representing the data in the form of tables, bar/pie charts and graphs.
However, matters can get complicated when bootstrapped product teams don’t have access to enterprise-grade surveying software and/or when the the problem they’re trying to solve for is more nuanced.
Let’s take a product feature for example — your team has just introduced grocery delivery in your food delivery app but the conversion rate is underwhelming. You have some theories as to why they’re not converting, but no concrete way of proving user preferences — so, you end up throwing user incentives, conducting surveys that require more follow-ups, and tweaking or adding more features in your app.
Enter conjoint analysis…
1. Conjoint Analysis
Conjoint analysis is a popular marketing research technique that marketers use to determine what features a new product should have and how it should be priced. Conjoint analysis became popular because it was a far less expensive and more flexible way to address these issues than concept testing.
In the article What is Conjoint Analysis by Chad Brooks on Business News Daily, a market research firm states that conjoint analysis is based on the principle that the relative values of a product or features are measured more accurately when considered holistically rather than when considered in isolation.¹
Going back to our example, let’s say we know quite a few variables that might influence a user to order grocery delivery. They are as follows:
- Price
- Quality
- Options
- Convenience
In conjoint analysis for market research, we assign utility scores to these variables and then add them up to identify what combination has the maximum utility for our users.
In UX research, conjoint analysis simply means presenting our users with certain scenarios and deciphering what they gravitate towards. It’s also important to test whether the null hypothesis is true or not.²

In the figure above, we’re forcing our users to think about the options in terms of scenarios and indirectly asking them — what matters more, what matters less? i.e. they’re assigning a utility score to the variables.
In market research, there can be as many as 30 such scenarios and each user gets randomized choices. The combination of variables are carefully curated so that they provide maximum insight from the data.²
In the article How User Researchers Can Adapt Conjoint Analysis by Gabriella Campagna, she correctly states that user researchers are often told to just “go talk to these people”. Instead of coming up with a typical user research question, if we frame it in the form of scenarios (for conjoint analysis)— it enables product managers and developers to better envision the hypothesis and champion your research efforts.
2. Maxdiff Scaling
Just like Conjoint Analysis, the Max-diff system measures the trade-off between variables — the difference is that it is simpler and easier to implement.³
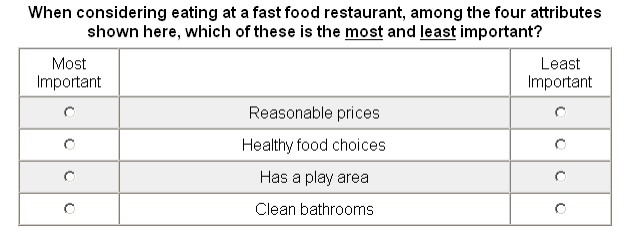
The above diagram demonstrates what a max-diff scaled question looks like. This is important because the common approaches (rating, ranking, and allocation tasks) have weaknesses.⁴
Rating
- Rating tasks assume that respondents can accurately communicate their actual desire for an item using a numeric rating scale, which is not the case.⁴
- Rating items on a numeric scale may not be discriminating enough and maybe prone to bias.⁴
- Respondents may have a tendency to be extreme when responding by sticking to certain parts of the scale.⁵
Ranking
- Ranking tasks become difficult to manage when there are more than seven items. It becomes hard to keep track for the respondent.⁴
- The results might be different when asking a respondent to rank high to low vs. low to high.⁵
Allocation
- Just like ranking, allocation tasks are challenging for respondents when there are many items.⁴
- The manual task of making the allocated points sum to a particular amount may interfere with respondents revealing their true preferences.⁴
- Respondents might use equal numbers to make the allocation task easier rather than tell us their true preferences.⁵
Max-diff solves for the above issues because it is concretely discriminating between variables, it has a lower cognitive load on survey takers and it is easy to interpret as well.
Let’s say we have a survey where the respondent has to evaluate four items, A, B, C and D. If the survey respondent says that A is best and D is worst, just these two responses inform us on five of six possible implied paired comparisons:
A>B, A>C, A>D, B>D, C>D
However, max-diff also has its drawbacks. Max-diff tells you how important the attributes are relative to each other, but it doesn’t tell you if they’re important in general.⁵ In such circumstances, choice based conjoint might be a better option.
Max-diff can also be time-consuming for respondents and may also require advanced statistical modeling such as Hierarchical Bayes.⁷ A more suitable alternative is Q Sort which works great on mobile. Q Sort essentially shows you the whole list and first asks you which ones you like the most, then it shows the remaining list and asks which ones you like the least. Q Sort can also become cumbersome when the list is long.⁷
Execution using free tools
Now that you know the benefits of conjoint analysis, let’s discuss how we can implement this using free tools. To properly conduct conjoint analysis, we’d have to randomize the choices we provide to our users. A simple way to do this in Google Forms is to duplicate surveys and then changing the choices manually, then serving that to our users at random. (You can segment your users randomly and serve them a different version of the survey.)
Airtable is a tool that is preferred for automating UX research processes and visualization but I still prefer the likes of Google Sheets and Microsoft Excel because of their preset formulas and mathematical functions. In quantitative research, for a product that has just started scaling — you need to gather large amounts of data and clean it (i.e. get rid of low quality data by identifying patterns). You don’t need to be a data scientist but you need to know some basic concepts and be good with spreadsheets.
For instance, in UX research a common practice is to preach being data informed vs. data driven. The concept of being data informed essentially tells you not to be obsessed with data, because of the implications of the unknown.

“What, are we gonna hold hands and sing Kumbaya here?” — Kevin O’Leary on Shark Tank when he hears emotional talk over business logic.
The book Lean Analytics by Alistair Croll and Benjamin Yoskovitz states, “Though data is undeniably important, collecting and analyzing it can become addictive.”
It then states that this can be problematic when let’s say a founder finds that pictures of models in bikinis increases conversion on his website and blindly uses that finding to undermine his business.⁸
Certain individuals can be over enthused by working with data, but UX researchers should also consider when to curb text-book quotes. In data science, when a hypothesis is only good for known data but does not represent unseen data accurately — it is known as having high bias or high variance.⁹ Data-driven approach already accounts for the unseen, by deciding a trade-off between bias and variance such that the error rate is the lowest.
If your sample size isn’t big enough, you need to get more data. Then you need to clean your data to get rid of variables that might not be relevant (known as dimension reduction). In data science, we always split the data into training and test to check the performance of our hypothesis. This has been noted in the article Over-fitting in Machine Learning, as a process known as cross-validation.⁹
In UX research, it’d mean deriving a hypothesis and then testing it again with new data to see if it still holds true. A good data-driven researcher will know how reliable the data is, by estimating error rates, bias and variance from over-fitting or under-fitting.
Understanding bias and variance is important when conducting research. Conjoint analysis and max-diff solves for exactly that by reducing cognitive load on respondents and helping us collect more accurate data; but do keep in mind the drawbacks of conjoint and accurately offset those in your survey design.
References
[1]: https://www.businessnewsdaily.com/6161-conjoint-analysis.html
[5]: https://www.relevantinsights.com/blog/making-the-case-for-maxdiff
[7] https://www.linkedin.com/pulse/discrete-choice-face-off-q-sort-vs-maxdiff-megan-peitz/
[8]: https://www.amazon.com/Lean-Analytics-Better-Startup-Faster/dp/1449335675
[9]: https://elitedatascience.com/overfitting-in-machine-learning