Using statistics in UX design
More than just average

Which one are you more likely choose when presenting the findings from user testing?:
1. Design A had a higher task completion rate than Design B.
2. Design A had a higher task completion rate than Design B by 38%.
Most, if not all, would pick the second choice. Numbers offer a nice summary of the data, and can give further credibility/assurance to your claim. This can be seen everywhere, especially in advertisement.

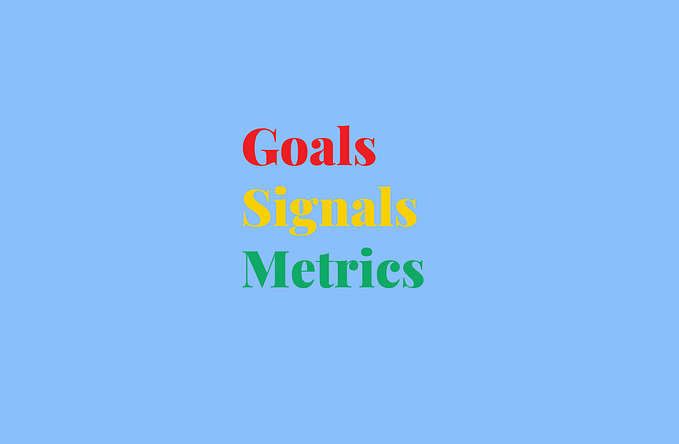
Similarly, UX Design also uses a lot of numbers — metrics. These can be anything from task completion time to Net Promoter Score. They provide valuable insight into whether or not a design is working as it should be. They can be used to compare to previous iteration, to a competitor’s product, or even a common benchmark. In other words, they’re important.
So now the question becomes:
How do we calculate metrics?
One thing that I am guilty of doing, and something I assume most people do, is simply taking the average. Simply add the numbers up, then divide by the number of users! Metrics aren’t so hard!
Well, turns out there are better ways of doing it.
One of the ways is by using the concepts of confidence interval and point estimates. This will be discussed in two parts:
- Overview of statistics and concepts
- How to apply statics in different situations
The purpose of this article is to provide you with just enough knowledge so that you can use the calculator provided as needed. Please do more research if you are interested in knowing the full math behind it.
Overview of Statistics
When you are designing, although you are focusing on a ‘user’, you are designing for lots and lots of people — sometimes millions. This is where statistics comes in to play. In inferential statistics, you take a sample from the population and try to estimate the parameter from the statistic.
In other words, from your pool of ALL users (population), you take 5 users (sample), calculate the satisfaction score of those 5 users (statistic), and try to estimate the satisfaction score of ALL users (parameter). If the average satisfaction score of the 5 users was 78% (statistic), you can use that to infer what the average satisfaction score of all the users (parameter) would be.

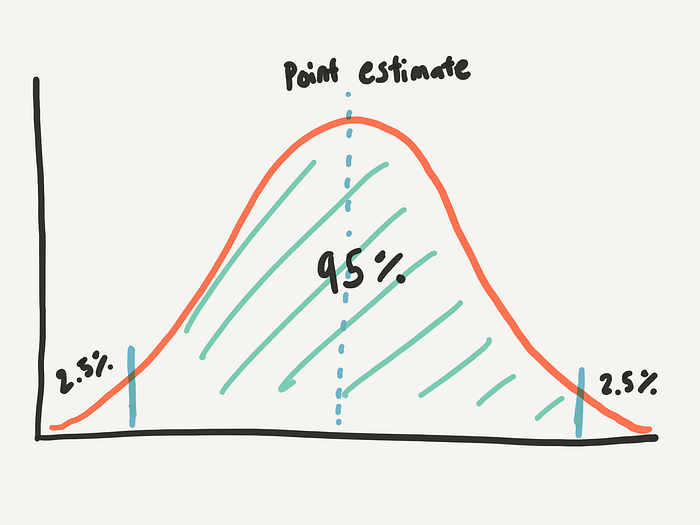
Another important concept is the confidence interval. A statistic estimates a single value. Confidence intervals, on the other hand, estimate a range of values — with a lower bound and an upper bound. This range depends on your confidence level. The confidence level is the percentage of all possible samples that can be expected to include the true population parameter [1]. The confidence level will usually be around 95% — this means that there is less than 5% chance that it could’ve happened by chance.
For example, let’s say you have a 95% confidence interval for a task completion time with the lower bound of 50 seconds and upper bound of 100 seconds. This means that when you do the same experiment 100 times, you can expect the true average (parameter) to be between 50 seconds and 100 seconds, 95 times out of the 100.
It should be noted that the type of analysis depends on the type of data. For example, method for calculating the confidence interval for task completion time is different than calculating the confidence interval for rating scale data. This will be discussed in the next section.
How to Apply Statistics in…
1. Completion/Failure Rate
Let’s take failure rates as an example. You test 5 people, and 3 of them failed to complete the task. You are inclined to say that it had a 60% failure rate. You can actually do a better estimate of the population using tools such as confidence interval and point estimate.
Confidence Interval
Doing the calculations with 95% confidence interval, you will find that the true task failure rate will be between 23% and 88%. This means that when you make the confidence interval 100 times, at least 95 of them will produce a task failure rate between 23% and 88%.
Now this is a huge range, but how is it helpful in anyway? According to the confidence interval, now you can say that you are confident that at least 1/5 (23%) of the users will fail to complete the task [2]. You can use this information to now shape your design direction to reduce this rate!
Point Estimate
Another good one is a point estimate. This is the same thing as a statistic that I mentioned earlier in this context. For this example, the point estimate is about 57%. This means that population, or ‘average user’ is likely to have about task failure rate of 57%. This is in between the range given by the confidence interval given above so it’s an acceptable value.
2. Task Completion Time
Task completion time is also one of the widely used metric. One special thing about task completion time is that it often varies greatly between users to users. Some of them may take less than a minute to do so, while other may take more than 5 minutes for the same task.
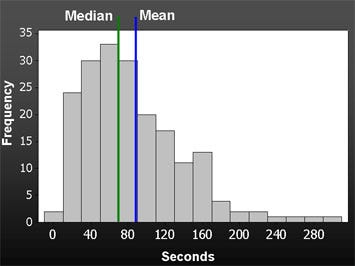
This introduces a problem — task completion time will most likely be ‘skewed’, meaning the overall trend will lean towards a certain pattern. This is bad because the analysis that we will be using, t-test, requires the data to look like a bell curve. Thankfully, the smart people have figured out a way around this.
The answer is to apply logarithm to the data (at least for small number of users). You can use the simple online calculator here to analyze the data. The web page itself also comes with explanation as to why we ‘log’ the data as well as the discussion about point estimate and confidence interval.
For the example, I will use task time of 60, 66, 75, 89, 126 seconds.
Confidence Interval
The 95% confidence interval after log transform comes out to be between 55.8 and 115.4. This simply means that the population median task time will be between 55.8 and 115.4 seconds. (The population average task time will be between these times)
Point Estimate
For task time, we use the median for large sample size (bigger than 25 data points), and geometric mean for anything below that.
Using the geometric mean, we can get from the example that the average task time for the population will be 80.26 seconds.
3. Questionnaires and surveys
Questionnaires and surveys will often have a score associated with them. For example, System Usability Scale (SUS) will use 10 questions to calculate a score to denote the usability of a product. Another example is Net Promoter Score. The math involved is similar to task completion time, but easier since we don’t have to use log. This is because they’re the same type of data, called continuous data.
The SUS score for the example will be 65, 83, 99, 78, 56. The same calculator as task time will be used. Calculator can be found here.
Confidence Interval
The confidence interval comes out to be from 56.8 to 98.4. You can interpret this similar to task completion time. The population mean SUS score will be between 56.8 and 98.4.
Point Estimate
Once again, similar to task completion time, except that SUS score will use arithmetic mean (what we call average). The arithmetic mean comes out to be 76.2. Therefore, it can be said that the average SUS score will be 76.2.
At a glance, this score is higher than the industry average of 68. Is it statistically significant? That will be a question answered in the next article in the series. (If there is interest)
Finishing Words
I hope you enjoyed the article and learned something new! If you are interested in learning more, I would recommend visiting MeasuringU and reading the book Quantifying the User Experience. I have also heard good things about Measuring the User Experience as well.
Final note, Jakob Nielsen puts this plain and simple in his article — YOU NEED TO GET QUALITATIVE DATA as well for your user research to be useful. Quantitative analysis only offers ‘what’, but qualitative analysis will offer ‘why’.
Ciao!
References
[1] https://stattrek.com/statistics/dictionary.aspx?definition=confidence_level
[2] Sauro and Lewis, Quantifying the User Experience