
UX Venn Diagrams
A simple formula to create your own UX Venn diagram
A few months ago, after just finishing a great meeting with a client, I took a taxi back together with my friend Mike who’s company was doing the designs for the project.
Mike was telling me about a recent UX event that he attended and how in one of the talks the speaker presented a good Venn Diagram about UX.
That particular Venn diagram included all sorts of things like product, strategy, design etc.. and I was thinking to my self: “that makes sense”!
But at the same time I realised that by now I must have already seen quite a lot of different UX venn diagrams and they all somewhat make sense.
So I came up with a simple formula for making UX Venn diagrams that anyone can use to make their own.
Create your own UX Venn diagram
Whether you are a “UX designer ninja unicorn supreme” or a just another person who “gets it”, you can now make your very own UX Venn diagram!

Here is a simple formula to create your own UX Venn diagram:
- Find the 3 values that you think your target audience will relate to the most. For example: if you are talking at a leadership summit, you can choose something like: Strategy, Principles and Purpose
- Draw three big circles that converge in the middle
- Place a value in each circle
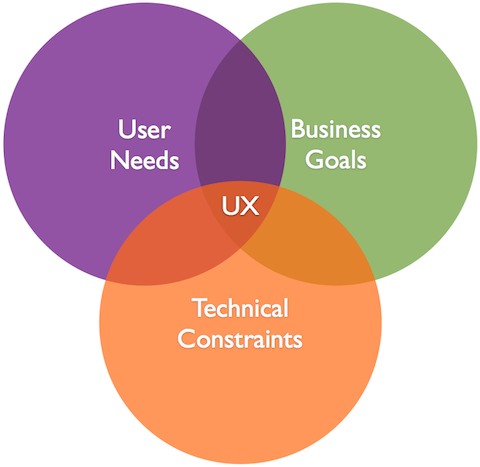
- Put “UX” in the middle
And there you have it! a perfectly viable UX venn diagram for your next presentation.
The result should look something like this:

Here are a few real ones:
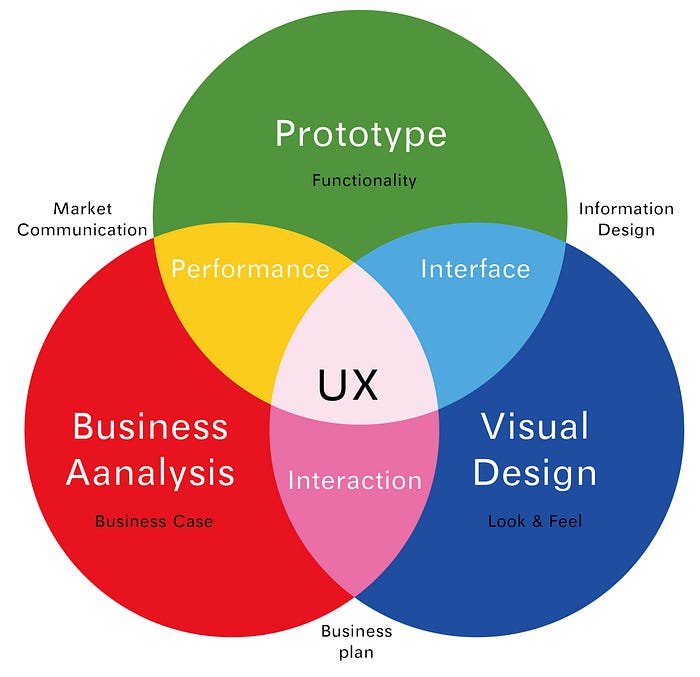
And remember: keep it simple and tangible, it is a “UX” diagram after all! ☺

