Your guide to Data Visualization for Comparison
A stepwise approach to getting better at data visualization

The world has got a sh*t ton of data, and nobody has the patience to go through it one row at a time. In order to make huge sets of data consumable, we need to present it in a much simpler format. Data visualization is a way of representing a collection of data visually. These visualizations allow the user to scan through huge amounts of data and derive patterns from it. The patterns allow the users to derive insights and take decisions on those insights. A lot of business decisions are driven by data now and with time we will only see an increase in the amount of data in the world.
This is an attempt to create a guide for data visualization mainly for beginners. We have categorized the data representations on the basis of the function it serves (comparison, distribution, correlation, trend over time). This publication is the first publication for data representations for comparison and it includes — Bar Chart, Stacked, Grouped & Overlapping Bar Charts, Multiple Series 3D Bar Charts, Clustered Force Layout & Bubble Chart. Given below is an elaborate explanation on all of these, however, if you prefer a shorter version our Behance project serves the need. Have a look at the Guide to Data Visualization — Comparison Part 1 on Behance. We’ve given our best to make it look pretty.
#1 Bar Chart
A bar chart is a type of column chart commonly used for Comparison. The bar chart works with two variables — one is the length of the bar and the second is the position of this bar on one of the axes. The bars can be plotted vertically or horizontally on a 2-dimensional plane. When various bars are plotted together, it’s easier to compare them, as the variable being compared is denoted by the length of the bars.
The bar chart can be used to show the comparison of one variable for multiple categories or comparison for value changes over a period of time. Given below is an example to put things in context. The graph shows the number of visitors on a website for a week.
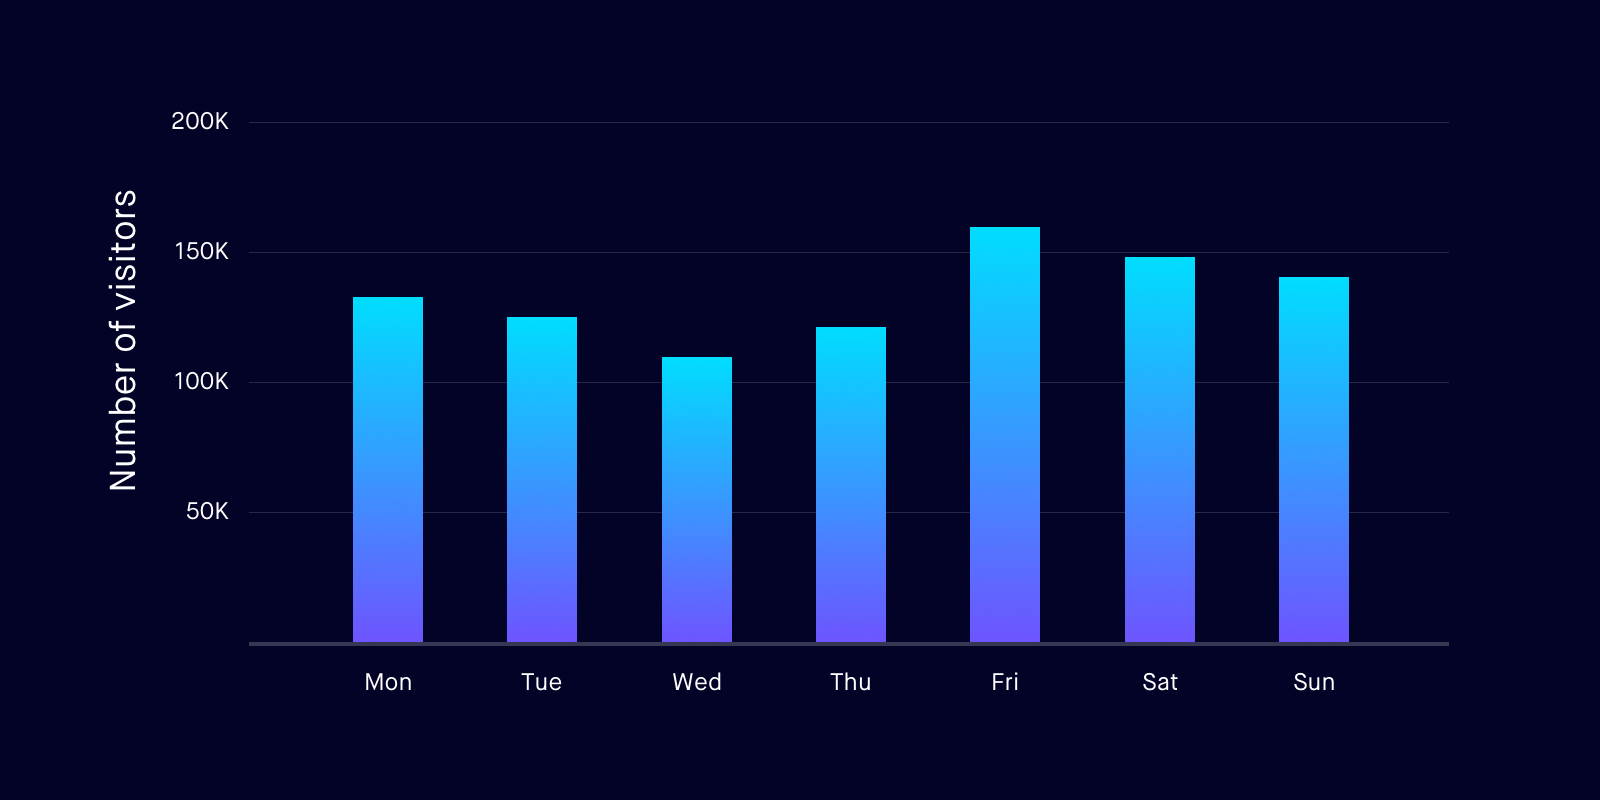
On the X-axis you have the day, and the Y-axis shows the number of visitors. Every day has a bar of its own, and the length of this bar indicates the number of visitors on that day. Even before the users start to consume the data, they can decipher when they had the maximum and the minimum number of visitors.
Best Practices for Bar Charts
- If you are plotting the change in a value over a period of time (days, months, years), always plot the time dimension on the horizontal axis.
- In charts, time should always run from left to right.
#2 Stacked, Grouped & Overlapping Bar Charts
Stacked, grouped & overlapping bar charts are various types of bar charts. The concept here remains the same as before — the length of the bar and the position of the bar help the user extract the data from the graph. However, these bar charts will allow the user to decipher more from the chart than your regular bar chart. Let’s check them out.
Stacked Bar Chart
Stacked bar charts add a new dimension to the regular bar charts. This chart also shows the composition of a bar. Legends are used to differentiate various constituents of the bar. Now that might sound complicated, so here’s an example.
Let’s say that in the previous graph, we have to show the sources of visitors along with the number of visitors on a website. There are 4 main buckets from where the users might arrive at the website — Social media, direct, search & others. The sum of visitors via all these buckets would be the total number of visitors. Here the 4 buckets are represented with different colors.

Best Practices for Stacked Bar Charts
- The groups under a category need to be limited to 5. Representing too many groups can make the graph unreadable.
Grouped Bar Chart
Similar to a bar chart where we compare two categories on the basis of one variable (which is represented by the bar), grouped bar chart allows us to represent a comparison between two categories on the basis of multiple variables (multiple bars grouped together). It’s important that all these variables can be measured with the same unit as these variables will be plotted against the same axis.
Taking the same example as that of the stacked bar graph, the visitors on a website can be represented with grouped bar charts too. In this case, every bucket (social media, direct, search & others) gets a bar of its own. All these bars are plotted against the Y-axis which would give the number of the visitors.

Best Practices for Grouped Bar Charts
- The groups under a category need to be limited to 4. Representing too many groups can make the graph unreadable.
- Two groups of bar charts must have a good margin between them in order to easily differentiate between the groups
Overlapping Bar Chart
An overlapping bar chart is one of the less popular bar charts but can be really useful in certain cases. Similar to grouped bar charts, overlapping bar charts are used to represent a comparison between two categories on the basis of multiple variables. But that’s not all, it’s specifically used when one variable is a part of another variable.
Given below is an overlapping bar chart that shows the number of visitors on an e-Commerce website along with the number of purchases. The blue bar denotes the number of visitors to the website and the yellow denotes how many of those visitors made a purchase. The number of visitors who made a purchase on the website is a subset of the number of visitors.

Best Practices for Overlapping Bar Charts
- Even though overlapping bar charts can be used to show multiple levels of subsets, the number of levels shouldn’t be more than 3 as it will become difficult to represent.
#3 Multiple Series 3D Bar Chart
Multiple series 3D bar chart is a 3-dimensional chart and is used for data sets with 3 data points. Consider an XYZ axis graph. Two axes (let’s say X & Y) have data points that can be measured in the same unit, and this unit is represented on the third axis (Z axis).
Let us plot the same example we’ve been looking at using multiple series 3D bar charts. Our 3 data points are — the number of visitors to the website, the days of the week and the source of the visits. If we plot the days of the week on the X-axis and the sources on the Y-axis, the bar plotted along the Z-axis would give us the number of visitors on a website for a particular day and a particular source. The length of the bar gives you the value of the variable being measured. The position of the bar chart on the plane gives us the category being compared.

Best Practices for Multiple Series 3D Bar Chart
- When plotting the Multiple Series 3D Bar Chart, it is very important that the margins between the bars on the X and Y axis are different. Otherwise, the bars behind might not be clearly visible because of the bars in front.
- Use multiple series 3D bar chart for limited data sets only, as large datasets will be very difficult to read with this chart.
#4 Clustered Force Layout
Clustered force layout, also known as clustered bubble chart is used for comparison. Categories under comparison are represented by circles and these circles are plotted close to each other as if forming a cluster of circles. The area covered by each circle is equivalent to the variable under comparison for the categories. When representing clustered force layout similar categories are kept in one cluster. The various types of clusters can be differentiated with the use of different colors as legends. One of the most popular examples of clustered force layout is a screen on Apple Music where you pick your favorite genres.
Let us plot a clustered force layout to understand this better. The example below shows the most searched for products on an e-commerce platform. These keywords are also categorized into which categories they fall in using different colors.

Well, looks like a lot of women have been looking for shoes.
Best Practices for Clustered Force Layout
- Make sure that the text on the bubbles is readable on the interface.
- Provide a scale of bubble size vs value for better understanding whenever possible. (Check out the example of bubble chart below)
- You can have multiple levels of clustered force layouts (nested clustered force layouts) which can be accessed by a click/tap. However, if you can highlight the categories using legends, prefer using legends over nested clustered force layouts.
#5 Bubble Chart
The bubble chart is used to represent data sets with 3 variables. It is plotted on a 2-dimensional plane, position of a bubble on this plane indicates 2 of the variables, and the 3rd variable is indicated by the area of the bubble. All the bubbles are circular in shape. Bubble charts help a user get an idea of the relative size of the data and compare it visually without the use of scales.
Let’s plot the traffic on a website via various channels over a period of four years.

The years are plotted on the X-axis, and the channels are listed on the Y-axis, and bubbles are plotted at the intersection of the two. The size (area) of the bubble represents the traffic. It tells us that the website probably did not have a social media presence in 2014. However, in 2017 social media was the largest source of users for the website. This way bubble charts can be really insightful by helping the user derive trends, and allowing the user to compare two sources at the same time.
Best Practices for Bubble Chart
- Generally, the value represented by a bubble is accessible via hover, but in cases where such interactions are not possible, provide a bubble size vs value scale along with the chart (as shown on the right side of the bubble chart).
- Space out the bubbles when plotting the chart, however, if that’s not possible make sure you show the overlapping bubbles by changing the opacity of blending mode of the bubble.
Check out the second part for comparison on this link and don’t forget to clap for the article.
Special Thanks To
Suvojyoti Ray, Dhruvi Shah, Prerna Pradeep, Prasanth Indran and Adhithya Vijai.
Find me on